Metallurgical Abstracts on Light Metals and Alloys vol.57

INDEX

12

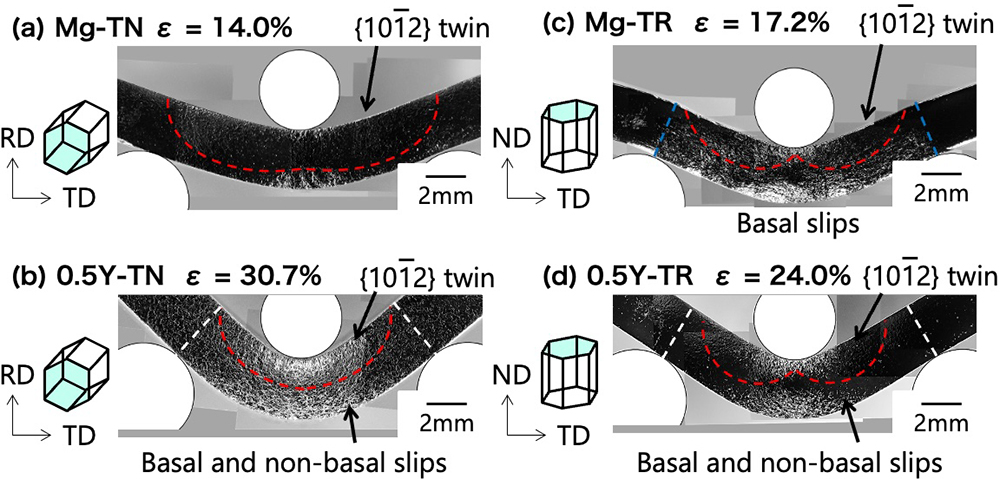
Optical micrographs of pure magnesium ((a) and (c)) and 0.5Y ((b) and (d)) after bending test. Mg-0.5Y showed enhanced bendability by activating non-basal slips in the tension side.

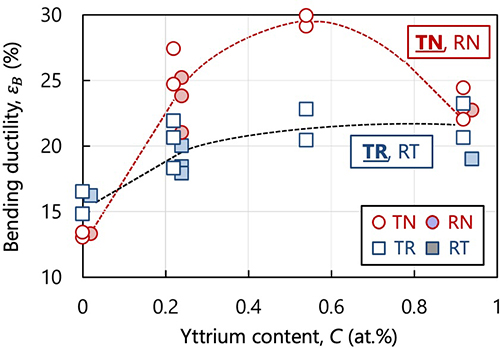
Relationship between bending ductility and yttrium content. The bending ductility of magnesium increased with increasing yttrium contents and showed orientation dependence.

31

Effect of Oxide Films on Fatigue Properties of Anodically Oxidized Aluminum Alloys

H. Akebono

[Published in Proceedings of 13th International Fatigue Congress (FATIGUE2022+1) (2023), pp. 233]

There is no difference in fatigue strength between anodized aluminum alloy and virgin in the regions above 180MPa and below 140MPa. It was confirmed that under axial loading conditions anodizing does not reduce fatigue strength in certain stress amplitude region. In addition, fatigue strength of the anodizing varied at 160 MPa.

35

Microstructure of the boundary between the SUS304 and CP-Ti regions after welding with using Zr-based metallic glass ribbons (a). The corresponding elemental distribution map of (b) Fe, (c) Ti and (d) Zr are also depicted.

41

Various factors control bone matrix orientation. Bone orientation is tightly controlled by genes, diseases, cell adhesion mechanisms, and cell-cell communication substances. These are the most important factors to consider in developing hard tissue-compatible bone medical materials.

60

Cross slip patterns on a plane normal to the elongated direction of WW specimen after the eight biaxial compressions for which the cumulative strain was 2. a3, b3, c3 and d3 mean slip systems activated during the compression.

75

Generation of aluminum hydroxide from industrial waste

K. Maekawa

[Published in proceedings of the 2024 Annual Meeting IEE of Japan, Vol. 4-163 (2024), pp. 272]

XRD analysis showed that the sample that was reacted with the addition of a catalyst and a long reaction time with a small temperature change was the most effective in suppressing the formation of baemite.

79

Minimum creep rate plotted against the respective applied stresses in double logarithmic plots. The thick lines represent the relationship between the creep rate and stress calculated using the CLLM, while the fitting lines represent the experimental data for each single-phase material.