1
Formation of Carbon-added Anatase-rich TiO2 layers on Titanium and their Antibacterial Properties in Visible Light
[Published in Dental Materials, Vol. 37 (2021), e37–e46]
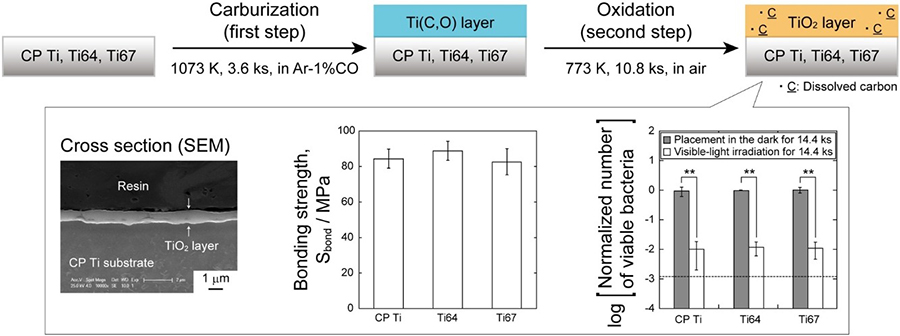
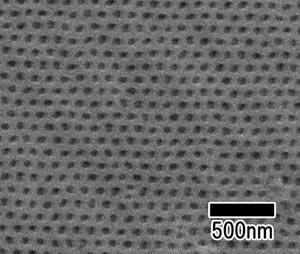
TiO2 layers, possessing both high bonding strength and excellent antibacterial properties, were successfully formed on practical dental Ti alloys via two-step thermal oxidation.