Metallurgical Abstracts on Light Metals and Alloys vol.54
Acoustic emission analysis during fatigue crack propagation by Bayesian statistical modeling
Takayuki Shiraiwa*, Hiroyuki Takahashi* and Manabu Enoki*
*Department of Materials Engineering, The University of Tokyo
[Published in Materials Science & Engineering A 778 (2020) 139087]
https://doi.org/10.1016/j.msea.2020.139087
E-mail: enoki[at]rme.mm.t.u-tokyo.ac.jp
Key Words: Fatigue crack growth, Acoustic emission, Bayesian inference, Iron alloys, Magnesium alloys
Acoustic emission (AE) during fatigue crack growth of pure iron, three carbon steels and two Mg-Y-Zn alloys were measured and analyzed using Bayesian approaches to classify the fatigue crack growth process into several stages. By formulating the relationship between fatigue crack growth rate and AE parameters with a multiple-changepoint model and applying the experimental data to Markov chain Monte Carlo (MCMC) analysis, the fatigue crack growth process was divided into four stages. The experimental observations revealed that the classified stages I to IV correspond mainly to microstructurally small crack region, physically short crack region, stable crack growth region and unstable crack growth stage, respectively. In addition, AE parameters significant for predicting crack growth were identified at each stage by Bayesian model selection. In the microstructurally small crack region of pure iron and magnesium alloy, peak frequency and duration were selected as the significant AE parameters, respectively. In the stable crack growth region, AE event rate was selected regardless of the material. By comparing the above results with the literature, it was demonstrated that the proposed method characterizes the fatigue crack growth process by AE signals without being affected by the decision of researchers and inspectors, which is useful for understanding fatigue crack growth behavior during material testing and structural diagnosis.
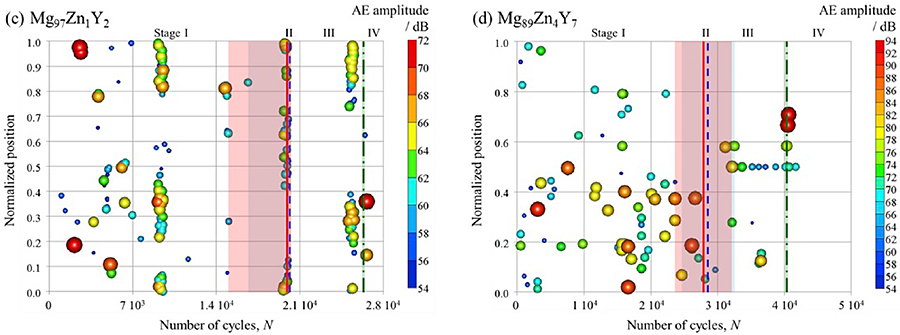
AE amplitude and normalized position at AE hit during fatigue tests of (c) Mg97Zn1Y2 alloy and (d) Mg89Zn4Y7 alloy. The vertical lines and the adjacent shaded region represent the mean and standard deviation of the transition points determined by MCMC simulation.