Long-period stacking/order (LPSO) structures formed in high-strength Mg alloys have attracted wide attentions, as they contribute to excellent mechanical properties through unique kink-type deformations. The LPSO structures occurs in a large number of Mg-M-RE ternary alloys (M: transition metals and Al, RE: Y and rare earth elements), and the LPSO characteristics can be traced along an intrinsic II-type stacking fault (I2-SF) of a local face-centered cubic (fcc) environment, which are essentially enriched by M and RE elements (SESF: solute-enriched stacking fault). Solute M/RE atoms within the SESFs form L12-type short-range order M6RE8 clusters, which are arranged along the hcp superlattice order; i.e., these are referred to as the in-plane order. In the present study, using electron microscopy we also attempt to identify the LPSO structure with the extra inter-cluster order in the Mg-Al-Y alloy. We here derive possible LPSO variant structures including interstitial atoms in the L12-cluster center, and compare their energetic stabilities with/without interstitial atoms according to first-principle calculations, under more accurate/reliable conditions than those employed in the previous work.
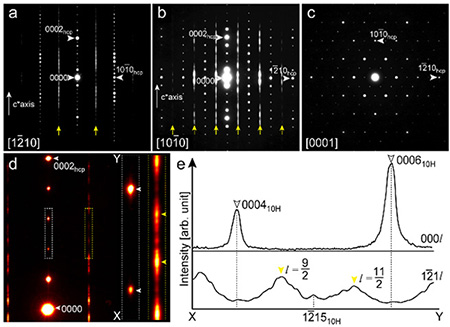
Figures 1 (a-c) show electron diffraction patterns obtained from the LPSO phase in the heat treated Mg75Al10Y15 alloy, respectively. By tracing the 000l series reflections in Fig. 1 (a), there appear four reflections between the 0000 and 0002hcp spots, indicating that the present stacking polytype belongs to the 10H-type lattice. Looking carefully at the reflection lines strongly streaked along the c-axis, as indicated by yellow arrows in Figs. 1 (a) and (b), there are certain maxima at some places. This is clearly seen in the magnified pattern of Fig. 1(d), in which the white/yellow rectangle regions are further enlarged at the right-hand side. The corresponding intensity profiles are obtained for the both rectangle regions and shown in Fig. 1 (e), revealing the series of 000l (upper) and 121l (bottom) reflections along the c-axis. The profiles verify the occurrence of an extra order beyond the stacking periodicity; double the 10H-stacking periodicity.
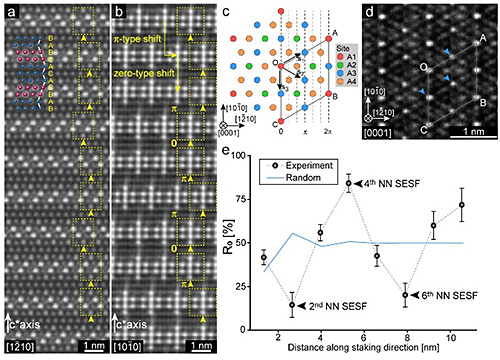
Figures 2 (a, b) show HAADF-STEM images of the 10H-LPSO phases. Characteristic bright-dot configurations represent the L12-Al6Y8 clusters, as indicated by yellow rectangles in Figs. 2 (a) and (b). Within each SESF all the clusters are arranged along with the 6×(1210)hcp (6M) in-plane order. Figure 2 (c) shows possible sites for placing the L12-type clusters within the framework of the 6M in-plane order, whose unit cell is shown by a rhombus (OABC). Figure 2 (d) shows a HAADF image taken along the [0001]hcp of the present LPSO phase. Bright dots represent the centers of the L12-cluster, and comparison with the possible cluster sites in Fig. 2 (c) lead to a conclusion that the cluster positions are almost limited to the A1 and A3 sites. Figure 2 (e) shows frequencies of the zero-type shifts, denoted as R0, across a number of the SESFs from the first nearest neighbor (1NN) to 8NN correlations derived from the STEM images. When the three variants of the A3-type shifts occur randomly, estimated R0 are plotted as “Random” in Fig. 2 (e). Evidently, the experimental R0-profile shows up with definite local minimum and maxima, whose behaviors are significantly deviated from that of the random case. Accordingly, this fact suggests that the A3-type variants tend to occur along with a certain ordered manner that is responsible for the extra order.
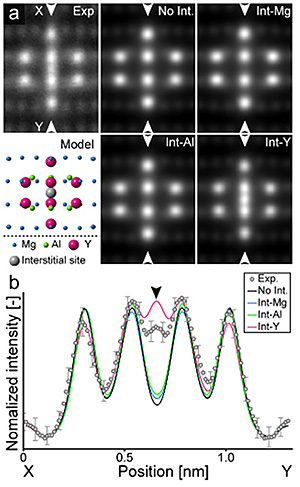
Figure 3 (a) shows experimental and simulated HAADF images of the L12-Al6Y8 clusters. Figure 3 (b) shows intensity profiles for the comparison between the experimental and simulated images, as obtained across X-Y vertical directions of each image. It is evident that the experimental image shows significant intensity at the interstitial site, as seen in Figs. 3 (a) and (b), confirming directly the interstitial occupations whose intensity is almost close to that of the Y occupation. Further image simulations have confirmed that the observed intensity can be well reproduced with the Y occupation of approximately 0.81 at the interstitial site. It is worthwhile to note that the present interstitial occupation turns out to be higher than that in the previous report 0.56, which may be caused by differences of the alloy compositions.
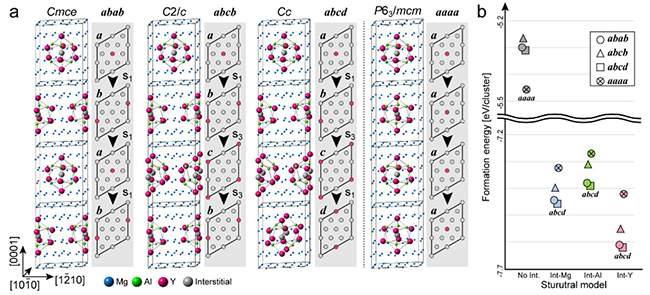
Figure 4 (a) shows representative variant structures generated by the A3-type and A1-type shifts (Fig. 2(c)) of the L12-type clusters, and two of them correspond to the extra order model. Figure 4 (b) shows formation energies for each of the models, being with/without the intra-cluster interstitial atom. The abcd model with the extra inter-cluster order turns out to be the lowest formation energies for all the interstitial elements, among which the Y-interstitial realizes the most energetically favored stable structure.