The change of mechanical properties and deformation mechanisms in fully recrystallized UFG specimens with different grain sizes, as shown in Fig. 1, were systematically investigated. We found that: (i) the plastic deformation of the coarse grained specimen (d = 23.3 µm) was predominated by {10-12}<10-11> twinning and {0001}<11-20> basal slip, and the quick decrease of work-hardening rate at the later stage of plastic deformation (Fig. 2) was due to the deceleration and saturation of deformation twinning, (ii) deformation twinning was dramatically suppressed in the UFG specimen (d = 0.98 µm), as is shown in Fig. 3, while non-basal slip systems having <c> component Burgers vectors were activated successively (Fig. 4). Particularly, the operation of the <c> component dislocations was responsible for the enhanced work-hardening rate. The present results showed a new insight that hexagonal Mg alloys can be very ductile by activating unusual deformation mechanisms (<c+a> dislocations) through realizing fully recrystallized UFG microstructures.
Change of Deformation Mechanisms Leading to High Strength and Large Ductility in Mg-Zn-Zr-Ca Alloy with Fully Recrystallized Ultrafine Grained Microstructures
[Published in Scientific Reports, Vol. 9 (2019), 11702]
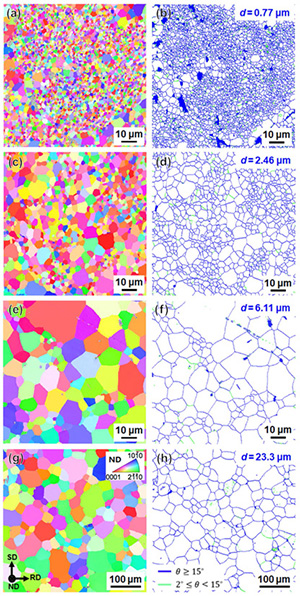
Fig. 1 EBSD-IPF maps (a, c, e, g) and corresponding GB maps (b, d, f, h) of the specimens HPT processed by 360° (γ = 23.55) and then annealed at various temperatures for different periods. (a, b) Annealed at 300°C for 1 min. (c, d) Annealed at 400°C for 30 min. (e, f) Annealed at 450°C for 30 min. (g, h) Annealed at 500°C for 30 min. The colors in the IPF maps indicate crystallographic orientations parallel to the normal direction of the HPT discs. The blue and green lines in the GB maps correspond to high angle grain boundaries (HAGBs) with misorientation angles larger than 15° and low angle grain boundaries (LAGBs) with misorientation angles between 2° and 15°, respectively.
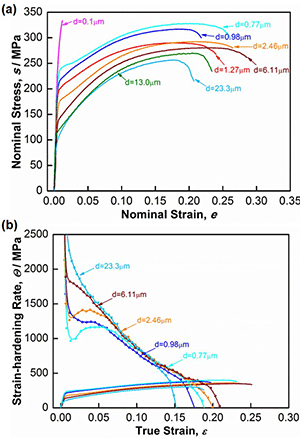
Fig. 2 Tensile properties of the specimens with various mean grain sizes. (a) Nominal stress-strain curves. (b) Curves showing work-hardening rate and true stress against true strain of representative specimens having different grain sizes.
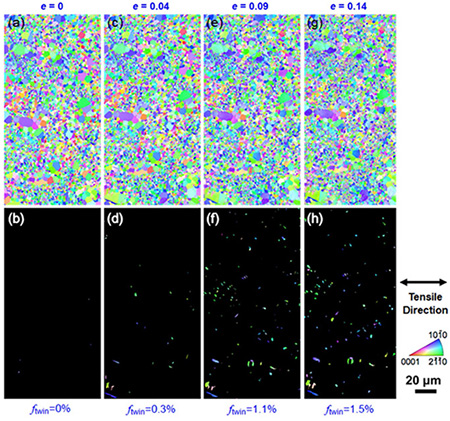
Fig. 3 Identical area observation by EBSD of the UFG specimen (d = 0.98 µm) after tensile deformation to specified strains. Upper row (a, c, e, g): EBSD-IPF maps of the whole area at different strains. Lower row (b, d, f, h): EBSD-IPF maps extracting only twinned areas. The colors in the IPF maps indicate crystallographic orientation parallel to the tensile direction (horizontal direction in the figures).
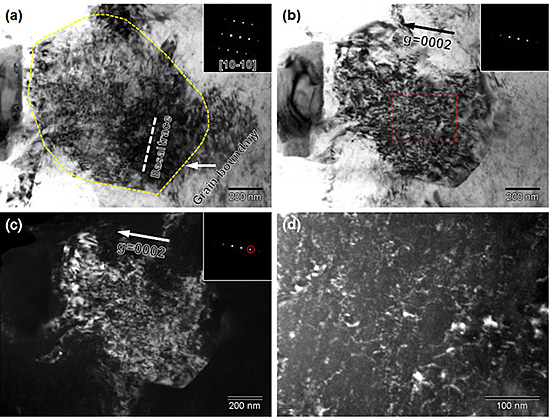
Fig. 4 Dislocation structures in a typical grain in the UFG specimen (d = 0.98 µm) tensile deformed to a strain of 0.095. (a) BF-TEM image observed along [10-10] zone axis. (b) BF and (c) corresponding DF-TEM images observed under two beam condition with g = 0002. (d) WBDF image of the rectangular area in (b) at higher magnification.