Mg has recently gained attention for use in transport industries due to its energy-saving light weight and high specific strength, yet studies on Mg fatigue fracture remain insufficient. Therefore, fatigue behavior of Mg is studied. Despite various other studies, however, a uniform understanding of Mg fatigue properties remains lacking since Mg, with its hexagonal close-packed (hcp) structure, shows deformation mechanisms dependent on crystal orientation, and effects of crystal orientation on fatigue properties in Mg remain unclarified. Therefore, research on Mg single crystal orientation dependence on fatigue properties has been conducted using compact tension (CT) specimens or thin sheets. However, the fatigue tests found different locations for stress concentration: around a notch in CT specimens and a hole in thin sheet specimens. Also, stress concentration and stress distribution must be considered to clarify fatigue fracture mechanism in the plain bending fatigue tests using thin sheets since high stress distributes on the surface of specimens by bending. To clarify these two issues, we prepared Mg single crystalline round-bar specimens with uniform stress distribution for uniaxial fatigue tests. In this study, three Mg single crystalline round-bar specimens with different crystal orientations were subjected to uniaxial tension-compression fatigue tests so as to investigate crystal orientation dependence on fatigue fracture behavior.
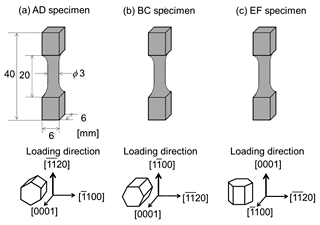
Mg single crystalline plates were grown by the modified Bridgeman method using a 99.9 % pure-Mg ingot. Three types of Mg single crystals with different crystal orientations were prepared. The loading direction of AD, BC and EF specimens was parallel to [1120], [1100] and [0001], respectively. Fatigue tests were carried out at a stress ratio of R = -1(R = σa min /σa max) using an electro-hydraulic servo fatigue testing machine operated at a frequency of 10 Hz at room temperature. Microstructures were observed using an optical microscope, a digital microscope, and an SEM.
Figure 1 shows dimensions and crystal orientations of Mg single crystalline specimens used in this study. The loading direction of AD, BC and EF specimens was parallel to [1120], [1100] and [0001], respectively.
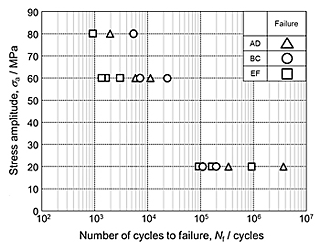
Figure 2 shows S-N plots: the relationship between stress amplitude and fatigue life.
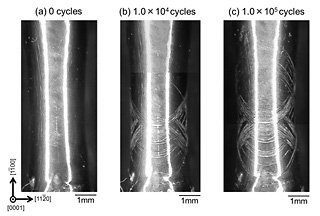
Figure 3 shows optical micrographs of BC specimen when the stress amplitude was 20 MPa after (a) 0 cycles (before fatigue tests), (b) 1.0![]() 104 cycles, and (c) 1.0
104 cycles, and (c) 1.0![]() 105 cycles. Two {1012} twin variants were clearly observed after 1.0
105 cycles. Two {1012} twin variants were clearly observed after 1.0![]() 104 cycles, but the area fraction did not change even after 1.0
104 cycles, but the area fraction did not change even after 1.0![]() 105 cycles.
105 cycles.
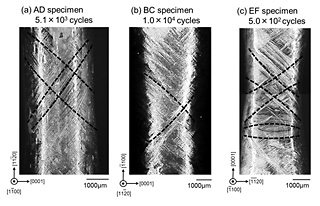
Figure 4 shows digital microscope images of (a) AD, (b) BC, and (c) EF specimens when the stress amplitude was 60 MPa. Dashed lines indicate traces of observed twin variants.
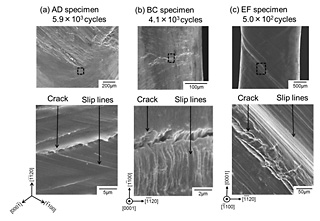
Figure 5 shows SEM images of resulting cracks and slip lines in (a) AD, (b) BC, and (c) EF specimens. In AD specimen, cracks and slip lines near the fracture surface were observed after the final fracture at 5.9![]() 103 cycles.
103 cycles.
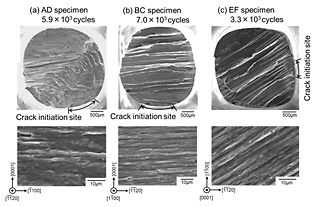
Figure 6 shows SEM images of fracture surfaces of (a) AD, (b) BC, and (c) EF specimens under stress amplitude of 60 MPa. A common striation-like pattern in one direction was observed in all specimens, and fracture surfaces were almost identical. Relatively flat surfaces were observed around the crack initiation site.
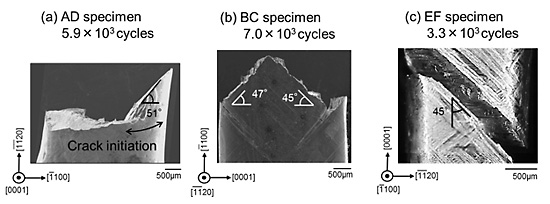
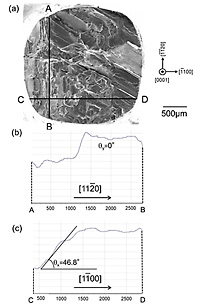
Figure 7 shows side views of fracture surfaces in (a) AD, (b) BC, and (c) EF specimens. Fracture surfaces in BC and EF specimens were found to be almost parallel to {1012}.
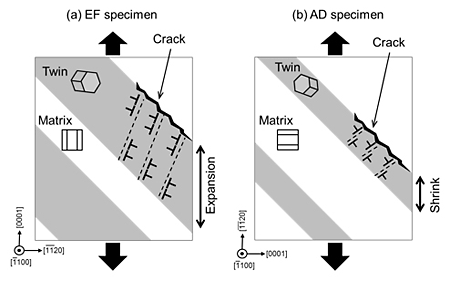
Figure 8 shows schematic illustrations of crack initiation mechanisms in (a) EF and (b) AD specimens at high stress amplitude greater than or equal to 60 MPa.
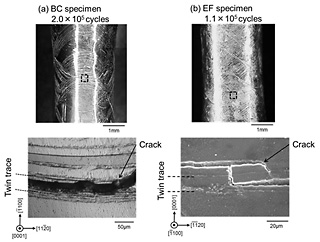
Figure 9 shows digital microscope and SEM images of twins and cracks in (a) BC and (b) EF specimens under stress amplitude of 20 MPa.
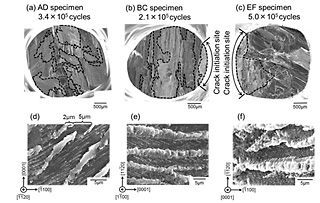
Figure 10 shows fracture surfaces of AD ((a) and (d)), BC ((b) and (e)) and EF((c) and (f)) specimens under stress amplitude of 20 MPa. Fracture surface areas in the figure surrounded by dashed lines are characteristic and differ from those observed at high stress amplitude. Enlargement of typical fracture surface is shown in Figs. 10 (d)-(f).
Figure 11 shows a SEM image (a) and fracture profiles ((b) and (c)) of EF specimen after fatigue testing of 5.0![]() 105 cycles.
105 cycles.
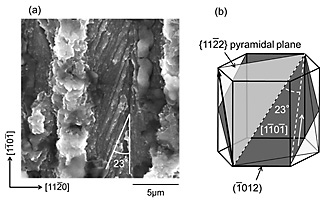
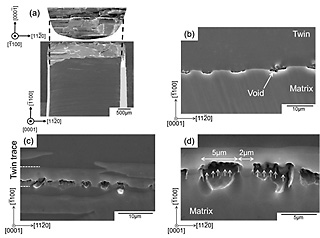
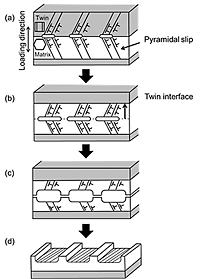
Figure 12(a) shows a SEM image of RS pattern in BC specimen when observed from the normal direction of the fracture surface after fatigue testing of 1.2![]() 105 cycles. The direction of ridges was parallel to [1101] and the angle between stripes and ridges was 23°. As shown in Fig. 12 (b), the line of intersection of (1012) fracture surface and (1122) second order pyramidal plane tilted 23° from [1101]. Therefore, stripes would form due to activation of second order pyramidal slips. To clarify the formation mechanism of RS pattern, the fracture surface of BC specimen was perpendicularly polished and the microstructure beneath the fracture surface was observed; results are shown in Fig. 13. Figures 13(b) and (c) show void arrays observed in different areas. Void arrays were found to form at twin interfaces, as shown in Fig. 13(b). Conversely, as shown in Fig. 13(c), the opening of voids and void arrays away from twin interfaces were observed.
105 cycles. The direction of ridges was parallel to [1101] and the angle between stripes and ridges was 23°. As shown in Fig. 12 (b), the line of intersection of (1012) fracture surface and (1122) second order pyramidal plane tilted 23° from [1101]. Therefore, stripes would form due to activation of second order pyramidal slips. To clarify the formation mechanism of RS pattern, the fracture surface of BC specimen was perpendicularly polished and the microstructure beneath the fracture surface was observed; results are shown in Fig. 13. Figures 13(b) and (c) show void arrays observed in different areas. Void arrays were found to form at twin interfaces, as shown in Fig. 13(b). Conversely, as shown in Fig. 13(c), the opening of voids and void arrays away from twin interfaces were observed.
Pure Mg single crystalline round-bar specimens with different crystal orientations were prepared and applied to uniaxial tension-compression fatigue tests at a stress ratio of R = -1 at room temperature. Crystal orientation dependence on fatigue fracture behavior was investigated. Loading directions of AD, BC and EF specimens were [1120], [1100] and [0001] respectively. The main results are as follows:
| 1. | At high stress amplitude greater than or equal to 60 MPa, fatigue life of BC specimen in which twinning occurs in compression was longest and fatigue life of EF specimen in which twinning occurs in tension was shortest. Fatigue life was found dependent on crystal orientation. The mechanism we propose for fatigue fracture is as follows: basal dislocations within twins accumulating at twin interfaces resulting in stress concentration and subsequent crack initiation; these cracks then propagate throughout specimens. |
| 2. | At a low stress amplitude of 20 MPa, crystal orientation dependence of fatigue life was not observed in all specimens. A common characteristic fracture surface consisting of ridges and regular stripes was observed, which we termed ridge and stripe (RS) pattern in this study. Voids were found to exist beneath fracture surfaces. We propose that RS pattern forms by internal crack initiation due to connections of voids. |
