Although Metal Matrix Composites (MMCs) have advantages for thermal management, the interfacial thermal resistance between the matrix and the reinforcement is one of the issues. The different mechanism of heat conduction between metals and ceramics causes the interfacial thermal resistance. The heat in metals is transmitted by lattice vibrations (phonons) and free electrons. On the other hand, the heat in ceramics is transmitted by the only lattice vibrations. In the MMCs, reflection and scattering occur at the interface of two different substances, and interfacial thermal resistance greatly affects thermal conductivity of composite materials. However, quantitative discussions on the degree of the influence of interfacial thermal resistance is not enough. SiC particle is one of candidates as a reinforcing material because it exhibits high elastic modulus, hardness and good thermal conductivity. In this study, interfacial thermal resistance in Al-SiC composites was evaluated by comparing the measured thermal conductivity and the calculated thermal conductivity, where the calculations were carried out by using Scanning Electron Microscope (SEM) image.
Figure 1(a) shows the microstructure of Al-20vol.%SiC composite. Image processing techniques such as smoothing, thresholding, morphology transformation were combined to binarize the SEM image. The finite volume method was used to calculate two-dimensional temperature distributions.
Figure 1(b) shows the simulation cell for the conduction calculation. The simulation cell included pores which was corresponding to the measured relative density. The thermal conductivity of Al was set to 204 W/(mK), the thermal conductivity of SiC was set to 270 W/(mK) and the thermal conductivity of pore was set to 0.0241 W/(mK). Simulation code can take into account of the coefficient of heat transfer at the interface. The coefficient of heat transfer between pore and material was set to 7 W/(m2K). The series of calculations were carried out by changing the coefficient of heat transfer between Al and SiC. The adiabatic boundary conditions were applied parallel to the heat flow direction and the periodic boundary condition was applied perpendicular to the heat flow direction. The temperature of the left edge of the elements was set to 301 K and the temperature of the remaining elements was set to 300 K as initial condition. The temperature of the left and right sides of the elements was fixed and the temperature of the remaining elements was iteratively updated until average variation of temperature of each element was lower than 10-14, and steady state of temperature distributions was obtained. Effective thermal conductivity of composite was evaluated from steady state of temperature distributions.
Figure 1 (c) shows the temperature distribution after the calculation, where 1.0![]() 105 W/(m2K) was used as the coefficient of heat transfer at the Al-SiC interface. Interfaces can be recognized in the figure because the coefficient of heat transfer was low and temperature gap appeared at the interface.
105 W/(m2K) was used as the coefficient of heat transfer at the Al-SiC interface. Interfaces can be recognized in the figure because the coefficient of heat transfer was low and temperature gap appeared at the interface.
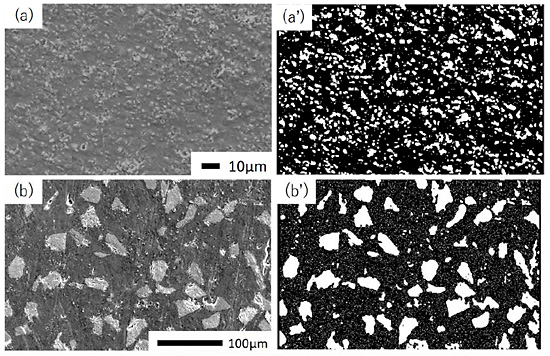
Figures 2 (a) and (b) shows the microstructure of Al-20vol.%SiC composite with SiC particle size of 3µm and 30µm, respectively. Figures 2 (a’) and (b’) shows the simulation cell for the conduction calculation.
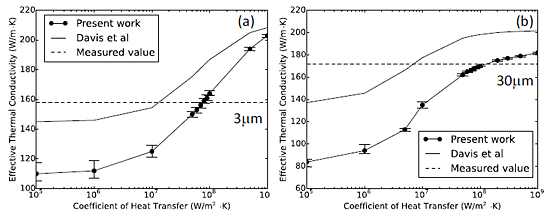
Figure 3 shows the calculated effective thermal conductivity respect to the coefficient of heat transfer at the Al-SiC interface. Filled circles with solid line represent the calculated effective thermal conductivity, and dotted line represents the measured effective thermal conductivity. Solid line represents the theoretical effective thermal conductivity suggested by Devis et al. The point of intersection of solid and dotted line represents the coefficient of heat transfer between Al and SiC.
Table 1 shows the measured effective thermal conductivity and relative density of the fabricated sample. The effective thermal conductivity was improved after the heat treatment although the relative density decreased.
Table 2 compares the coefficients of heat transfer evaluated by the present image-based calculation and the model of Davis et al. The coefficients of heat transfer of the present work is larger than that of Davis et al. Table 2 also shows the coefficients of heat transfer calculated by Phonon diffuse mismatch model (DMM) . The coefficients of heat transfer of the present work are smaller than that of Phonon DMM. Although interfacial misfit is not considered in the Phonon DMM, interfacial misfits possibly exist in the fabricated sample. These misfits lowered the coefficients of heat transfer. Interfacial thermal resistance was also evaluated as shown in Table 2.


