Martensitic Transformation Induced in Ti-15V-7Al Alloy at Low and High</sup>& Temperatures
Yoshito Takemoto1, Miyu Tsunekawa1 Yuji Manabe2 Soushi Itano2 and Yuji Muraoka3
1Graduate School of Natural Science and Technology, Okayama University, Okayama 700-8530
2Faculty of Engineering, Okayama University, Okayama 700-8530
3Research Institute for Interdisciplinary Science, Okayama University 700-8530
Ti-15V-7Al alloy, which has a composition exhibiting peculiar phenomena upon tempering, was prepared and its martensitic transformation behavior during cooling and heating was investigated. Figure 1 shows (a) the microstructure of STQ (solution teatment and quench) and (b) the structure after subzero treatment using LN2. Most of the STQ specimen consists of the β-phase, but a small amount of acicular α” martensites can be seen near the grain boundaries. Figure 2 shows (a) the STQ microstructure and (b) the structure tempered at 550°C for 3 s. Surprisingly, coarse acicular products formed in the entire sample in a very short time. XRD measurement was performed in order to confirm the structure change. Figure 3 shows XRD profiles obtained before (a) and after (b) the tempering at 550°C for 3 s. The structure of the STQ sample (a) is almost β-phase, and small α” peaks can be seen before the tempering, whose intensity became much stronger after the tempering (b). Therefore, the acicular product generated by tempering was ascertained α” structure. Every coarse α” product formed by quenching, subzero treatment and tempering for a short time, however, were disappeared by aging at 200°C for 5 min, and turned to β-phase inversely. The martensitic transformation behavior was reversibly occurred between 200°C and 550°C for a short time. However, long time holding over 180 s at 550°C induced an atomic diffusion as shown in Fig. 4. Figure 5 shows a schematic diagram of the free-energy (G) relation between β and α for different temperatures to explain the transformation behavior. It is assumed that Gα has a spinodal decomposition type in the β+α field. With decreasing temperature, the position of the maximum Gα shifts to the higher-composition side. Assuming that the composition of 15VA is c0 in the figure, the energy relation between both phases changes as follows: Gβ<Gα (1050°C), Gβ<Gα (550°C), Gβ<Gα (200°C), and Gα<Gβ (LN2). This relation can successfully explain the peculiar phase stability.
[Published in Journal of The Japan Institute of Metals and Materials, Vol. 82, No. 8 (2018), pp. 307-313]
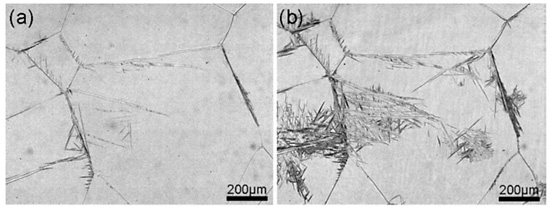 |
| Fig. 1 Optical micrographs taken before (a) and after (b) subzero treatment. |
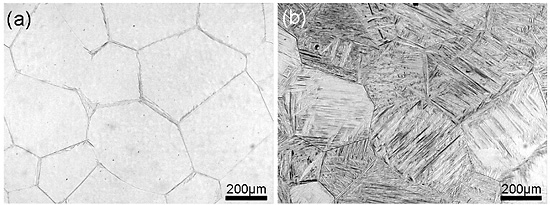 |
| Fig. 2 Optical micrographs taken before (a) and after (b) tempering at 550°C for 3 s. |
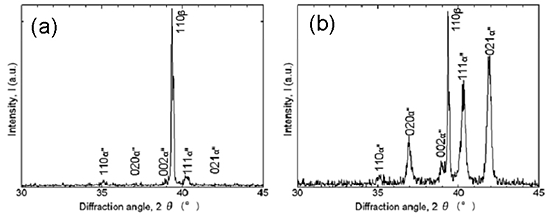 |
| Fig. 3 XRD profiles obtained before (a) and after (b) tempering at 550°C for 3 s. |
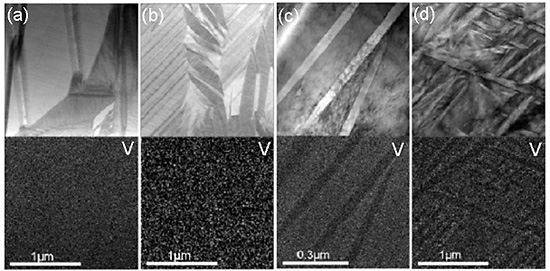 |
| Fig. 4 STEM images and V element maps after isothermal aging at 550°C for (a) 7 s, (b) 60 s, (c) 180 s and (d) 900 s. |
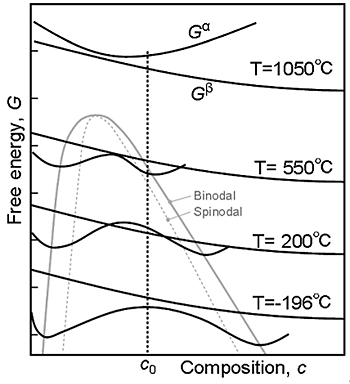 |
| Fig. 5 Schematic diagram showing free energy (G) relation between α and β. The curve of Gα in the dual phase (α+β) field shows a spinodal-decomposition type. With decreasing temperature, the stable phase at the c0 composition alternately changes. Possible binodal (solid) and spinodal (dashed) lines are also shown. |


