For energy efficiency purposes, magnesium alloys application to transport components are anticipated due to low density (thus light weight) relative to their high specific strength. To this end, fatigue fracture behaviors of magnesium alloys have recently under study. Fatigue crack behavior of pure magnesium have reported that fatigue crack propagation mechanism depends on crystal orientation in single crystals using compact tension (CT) tests. Crystallographic orientation dependence of fatigue life in pure magnesium single crystals using bending fatigue tests was also reported. In magnesium alloys with 0.03 mol% cerium addition, non-basal slips are easily activated, resulting in great improvement of cold workability. However, fatigue fracture behavior has yet to be elucidated. In this study, magnesium-cerium alloy single crystals were subjected to fatigue tests so as to investigate effects of cerium addition on fatigue fracture behavior.
Pure magnesium, magnesium-0.016 mol% cerium (16Ce) and magnesium-0.028 mol% cerium (28Ce) single crystals were produced using a Bridgman furnace.
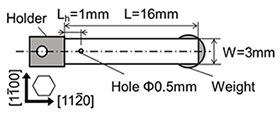
Figure 1 is a schematic illustration of thin sheet specimens for fatigue tests. Plane bending fatigue tests for thin sheet specimens were used in this study. In the test, thin sheet specimens were fixed to an acoustic speaker to provide resonance which resulted in cyclic bending stress being loaded at the hole in the specimen. Stress amplitude, σa, was calculated using the amplitude applied to thin sheet specimens. Plane bending fatigue tests were carried out at a frequency of 192-406 Hz at room temperature with a stress ratio of R = -1. The fatigue tests were stopped at 108 cycles, prior to specimen failure. Crack lengths on normal planes of thin sheet specimens in the fatigue tests were measured with an optical microscope.
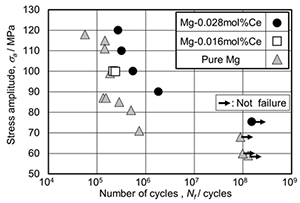
Figure 2 shows S-N plots indicating the relationship between stress amplitude and fatigue life. Fatigue limit of pure magnesium was approximately 70 MPa. On the other hand, 28Ce had fatigue limits between 75 and 90 MPa, meaning that cerium addition increased fatigue limit by approximately 10 MPa. Fatigue life of 16Ce was slightly longer than that of pure magnesium and 28Ce showed the longest fatigue life, indicating that fatigue life lengthens with increasing cerium addition.
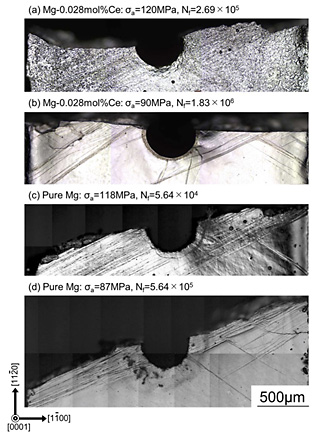
Figure 3 shows optical micrographs of crack profiles. As shown in Fig. 3(a), many lines consisting of micro-cracks (micro-crack rows) were observed around the hole just after loaded at a strain amplitude of 120 MPa in 28Ce. A crack initiated at a micro-crack row around the hole; however, the initial crack macroscopically propagated along [1100]. At a stress amplitude of 90 MPa, the crack propagated along [1100] as shown in Fig. 3(b). Micro-crack rows were also observed in pure magnesium when the stress amplitude was 118 MPa, as shown in Fig. 3(c). When the stress amplitude was 87 MPa, most cracks propagated along micro-crack rows, as shown in Fig. 3(d). These results indicate that cracks tend to propagate along [1100] by cerium addition.
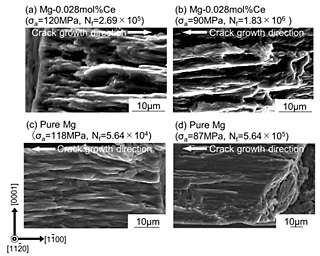
Figure 4 shows SEM images of fatigue fracture surfaces of 28Ce and pure magnesium single crystals. Striation-like patterns parallel to [1100] were observed around crack initiation sites on fracture surfaces in both 16Ce and 28Ce (Figs. 4(a) and (b)), and pure magnesium (Figs. 4(c) and (d)) single crystals. The striation-like patterns were widely observed in both 16Ce and 28Ce. On the other hand, striation-like patterns were seldom observed in pure magnesium single crystals under low stress amplitude.
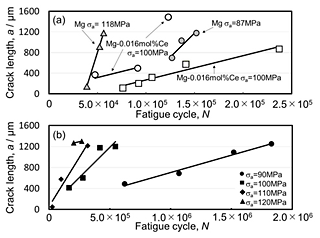
Figure 5 shows fatigue crack lengths as a function of the number of fatigue cycles, N. Fatigue crack growth rates, da/dN, were estimated from the slopes. da/dN were found to decrease with increasing cerium addition.
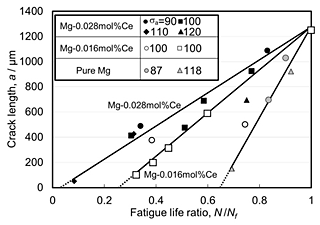
Figure 6 shows surface crack lengths, a, as a function of cycle ratio, N/Nf, which refers to the number of cycles to failure divided by cycle number. Surface crack lengths of each sample show a linear relationship with cycle ratio but no constancy with each stress amplitude. Also, the slope of the lines decreased with decreasing cerium addition. Fatigue crack life is expected to shorten due to cerium addition. Therefore, cerium addition facilitates crack initiation and but slows the da/dN, resulting in that Mg-Ce alloys show long fatigue life.
Two types of magnesium-cerium (Mg-Ce) alloy single crystals, Mg-0.016 mol%Ce and Mg-0.028 mol%Ce, and pure magnesium single crystals were subjected to fatigue tests to clarify the effects of cerium addition on fatigue fracture behavior of magnesium. Cerium addition was found to increase both fatigue limit and fatigue life of magnesium. In pure magnesium single crystals, cracks propagated parallel to [1100] at lower stress amplitude and along micro-crack rows inclined 30 degrees from [1100] at higher stress amplitude. Conversely, cracks propagated parallel to [1100] in Mg-0.028 mol%Ce despite the stress amplitude. Addition of cerium to pure magnesium was found to shorten fatigue crack initiation lives and to slow crack propagation rates.
