1. Introduction
The 3D crack and grains interaction affects crack plane orientation and morphology in grains leading to variations in crack growth rate. In this study, the crack propagation is investigated at increasing number of cycles in the microstructure (α, α+β phases, and interface) at sub-grain level growth (5 µm). Moreover, as the short crack length increases, there will be a transition in the interaction between the 3D crack and microstructure. This transitional interaction and its effect on the 3D crack path and growth rate variations is studied.
2. Materials and experimental procedures
The Ti-6Al-4V alloy was hot rolled at 800°C resulting a 50% overall thickness reduction. Afterwards, it was tempered up to 900°C during 96 h in the furnace and cooled down to the room temperature. At the end of heat treatment, this alloy was composed of 65% hexagonal close-packed (hcp) primary α phase and 35% of acicular secondary α phase within the body center cubic (bcc) β phase (α+β phase). A load-controlled fatigue test was performed at R = 0.1 with a frequency of 15 Hz. A specimen with a square cross section of 800 800 µm was made by electro discharge machining. In situ computed tomography (CT) at the BL20XU beamline of SPring-8 was employed to measure scan the growing crack on the surface and inside the alloy. The monochromatic X-ray energy of 30keV was produced by a liquid nitrogen-cooled Si (111) double crystal monochromator.
3. Results
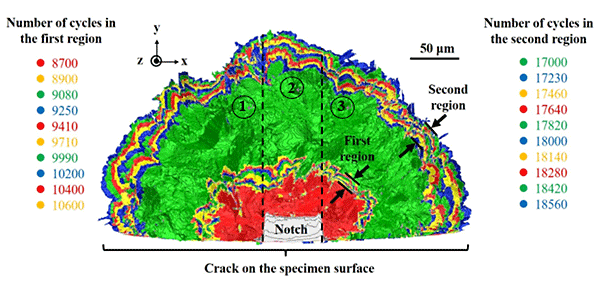
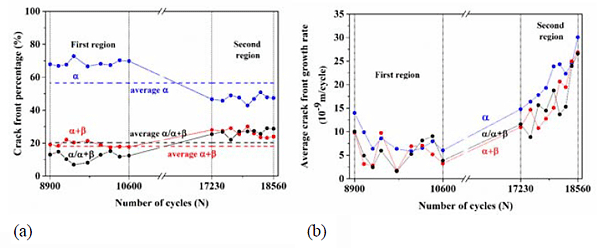
The superimposed 3D crack front images for both crack front regions is shown in Fig. 1. As it can be seen, in the first region (8700 to 10,600 cycles) crack front has an irregular shape and it has lower growth on the right side near the specimen surface as compared to the left one. This implies that crack front has a tendency to grow in some location in the microstructure more than the others especially in the first region. However, this tendency becomes less significant in the second region. Regarding the α phase, a total of 198 grains were identified, which consist of cracked grains and their surrounding grains. A number of 15 and 34 cracked grains were identified in the first and second region, respectively. In the first region, the crack front growth rates are high on the left side at 8900 cycles, this is due to crack growth in facet-like planes in grains as compared to the non-facet-like ones. However, the crack growth rates on the right side become close to the left side at 10,600 cycles, which shows the interaction between left and right side of the crack front. In the second region, the crack front growth rate is similar along the crack front at 17,230 cycles with increasing percentage of crack front in α+β phase and interface. The crack growth rate increases in some α grains, in α+β phase and interface at the last cycle. In order to quantify the crack front and microstructure interaction in each cycle, the temporal crack front percentage growing in α, α+β phases and on the interface (α/α+β) in both regions were determined. In the first region, the crack front percentage in α+β phase is close to the average microstructural fraction of α+β. However, this percentage is higher and lower than the average fractions in α phase and in interface, respectively (Fig. 2). Therefore, the crack front path grows at some location in the α phase without passing through interface. This local crack growth in α phase, depends on crack path morphology and grains crystallographic orientations, which induce an irregular crack front shape. The crack has the highest average growth rate in α phase (Fig. 2) as compared to other microstructural parts that have lower rates and vary from cycle to cycle.
In the second region, the crack front grows into the α phase with lower fractions than the average microstructural ones. However, the crack tends to follow the α+β phase and interface with higher rates than the microstructural fraction. This may be due to crack growth on unfavorable crystallographic orientation in α phase, which induces crack growth in α+β phase and interface. The crack growth rates gradually increase in the α, α+β phases and interface until reaching the highest average crack growth rate (Fig. 2). The crack growth rate gradually increases in the α+β phase and interface with lower values as compared to α phase. Two distinct types of crack planes in the α phase are observed, which are the facet-like and non-facet-like planes. As it can be seen from Fig. 3, crack front is growing through facet-like planes with higher percentage as compared to the non-facet ones in the beginning of the first region. However, at the end of the first region the crack front percentage in facet-like planes decreases. By comparing crack growth in each cycle, the results show that the facet-like average growth is 1.8 to 8.9 times faster than the non-facet-like growth in the first region (Fig. 3). This shows that crack growth in facet-like planes are prone to local rate variations due to the crack front interaction with non-facet like planes.
4. Conclusions
The effects of 3D microstructure on the short crack growth rates in a bimodal Ti-6Al-4V alloy is investigated at two crack front regions. In situ computed tomography to measure short crack growth in the α, α+β phases and interface. The crystallographic orientations of 3D grains in the α phase was identified using serial sectioning coupled with electron backscattering diffraction (EBSD). Crack front preferably grows in α phase higher than the average microstructural fraction, but it grows into α/α+β (interface) and α+β phase below and close to average fraction, respectively. Crack growth rate in α phase has the highest crack growth rate as compared to α+β phase and interface. This may be due to the crack growth on the facet-like planes with higher average growth rates than the non-facet-like ones in the first region. However, it was shown that the local crack growth rates in facet-like or non-facet-like planes depends on the interaction with neighboring cracked grains at the crack front. As the short crack front grows in the second region, crack front percentage following the α phase decreases below the average microstructural fraction but the crack percentage following the α+β phase and interface increase. The average crack growth rates gradually increase in α, α+β phases and interface. There is a decrease in the percentage of crack front growing in facet-like planes but this percentage increases at the end of the second region due to crack bifurcations and due to formation of secondary cracks.


