Low pressure casting process for unidirectional carbon fiber reinforced aluminum (UD-CF/Al) composites which is an infiltration route of molten Al into porous UD-CF preform has been a cost-effective way to obtain metal matrix composites (MMCs), but easy to cause non-uniform fiber distribution as CF clustering. Such clustered CFs have been a problem to decrease the density and thermal conductivity (TC) of composites, due to the existence of pores in the clustered area. To obtain high thermal performance composites for heat-sink application, the relationship between fiber distribution and porosity has to be clearly investigated. Recently spatial distribution descriptors such as 2-dimensional local number (LN2D) or 3-dimensional local number (LN3D) method have been used to estimate the spatial distribution of second-phase particles in MMCs by quantitative experiment by K. Sugio and G. Sasaki in Hiroshima Univ. In case of the distribution of UD-CFs in Al matrix, the LN2D evaluation from the cross-sectional microstructure of UD-CFs in UD-CF/Al composites can be useful method. In this study, the distribution of UD-CFs in UD-CF/Al composites depending on added Cu sizes was evaluated by the quantitative analysis using LN2D method. Moreover, the relationship between fiber distribution values and porosity of the composites was also discussed.
The coal tar pitch based UD-CFs (K13D2U, Mitsubishi Plastics, Inc.) in 11 µm dia. and Cu particles with four different average particle sizes from 2.55 to 28.86 µm were prepared as raw materials for UD-CF preforms. The UD-CF preforms were fabricated by spark plasma sintering (SPS) process as follows: The Cu particles mixed with polyethylene-glycol (PEG) as dispersant were dispersed in UD-CF bundles by rolling process. Subsequently, the UD-CF mixtures were put into the graphite mold in dimension of ø10 ![]() H10 mm3 and spark sintered. The spark sintering conditions to obtain porous CF preforms from CF-Cu mixtures were 1123 K for 1800 s under vacuum of 2.7
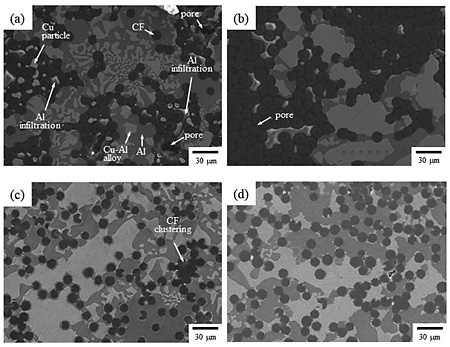
H10 mm3 and spark sintered. The spark sintering conditions to obtain porous CF preforms from CF-Cu mixtures were 1123 K for 1800 s under vacuum of 2.7 ![]() 10-2 Pa without applied pressure. The volume of UD-CFs and Cu particles in CF preform was 0.3 and 0.1, respectively. The LPI process was carried out on those obtained porous preforms for the fabrication of UD-CF/Al composites. The porous UD-CF preform was set into the graphite mold with vertical directional arrangement of UD-CFs array and the molten Al (A1070) poured into the upper part of the preform and then pressed by graphite punch. The molten Al was infiltrated into vacant inter-fiber regions of the UD-CF preform at 1123 K for 60 s with the external applied pressure of 0.8 MPa under Ar environment. The microstructures of UD-CF/Al composites added with different Cu particle sizes were shown in Fig. 1.
10-2 Pa without applied pressure. The volume of UD-CFs and Cu particles in CF preform was 0.3 and 0.1, respectively. The LPI process was carried out on those obtained porous preforms for the fabrication of UD-CF/Al composites. The porous UD-CF preform was set into the graphite mold with vertical directional arrangement of UD-CFs array and the molten Al (A1070) poured into the upper part of the preform and then pressed by graphite punch. The molten Al was infiltrated into vacant inter-fiber regions of the UD-CF preform at 1123 K for 60 s with the external applied pressure of 0.8 MPa under Ar environment. The microstructures of UD-CF/Al composites added with different Cu particle sizes were shown in Fig. 1.
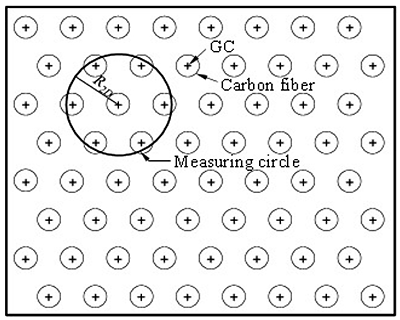
The differences of CFs distribution were clarified by LN2D method. It can be assumed that the gravity centers (GCs) of cross- sectional circle shapes of UD-CFs are arranged in homogeneous distribution such as closest hexagonal structure. In this case, one GC is surrounded by closest other GCs of neighboring CFs. A circle was named ‘measuring circle’ having a center at a GC of a dispersed particle, and the radius (R2D) of the measuring circle determined by the distance between closest other GCs and the GC at the center of measuring circle. The definition of measuring circles was also applied at the cross-sectional microstructure of UD-CF/Al composites. In the ‘closed-packed’ hexagonal structure of CFs in Al matrix, namely ‘ordered distribution’, as shown in Fig. 2, one measuring circle includes 7 GCs and the number density per unit area is determined to 7/![]() R2D2. The local number density can be regarded as the whole number density. Note that the number of GCs in the measuring circle is defined as LN2D. Since the ordered distribution has unique frequency average (LN2Dave) and variance (LN2Dvar) values, the values of random or disordered distribution can be easily evaluated the quantitative difference of distribution comparing to the ordered distribution. Various CFs distribution types of UD-CF/Al composites depend on added Cu particle sizes as shown in Fig. 1. The added Cu sizes affected not only CFs distribution but also density of the composites. The theoretical Cu spacer sizes were calculated by geometrical models for uniform fiber arrays, and thus the theoretical Cu sizes for 30 vol% of 11 µm diameter CFs were calculated to 11.08 and 14.17 µm for uniform square and hexagonal CFs distribution, respectively. The addition of Cu particles with near theoretical size (11.79 µm) in UD-CF/Al composites showed less CFs clustering and higher density than that of small size (2.55 µm) or large size (28.86 µm). The composites added 2.55+11.79 µm Cu to eliminate even still remained CF cluster showed near-fully dense morphology without significant CF clustering. The size control of Cu particles revealed an effective way to avoid fiber clustering in the composites.
R2D2. The local number density can be regarded as the whole number density. Note that the number of GCs in the measuring circle is defined as LN2D. Since the ordered distribution has unique frequency average (LN2Dave) and variance (LN2Dvar) values, the values of random or disordered distribution can be easily evaluated the quantitative difference of distribution comparing to the ordered distribution. Various CFs distribution types of UD-CF/Al composites depend on added Cu particle sizes as shown in Fig. 1. The added Cu sizes affected not only CFs distribution but also density of the composites. The theoretical Cu spacer sizes were calculated by geometrical models for uniform fiber arrays, and thus the theoretical Cu sizes for 30 vol% of 11 µm diameter CFs were calculated to 11.08 and 14.17 µm for uniform square and hexagonal CFs distribution, respectively. The addition of Cu particles with near theoretical size (11.79 µm) in UD-CF/Al composites showed less CFs clustering and higher density than that of small size (2.55 µm) or large size (28.86 µm). The composites added 2.55+11.79 µm Cu to eliminate even still remained CF cluster showed near-fully dense morphology without significant CF clustering. The size control of Cu particles revealed an effective way to avoid fiber clustering in the composites.
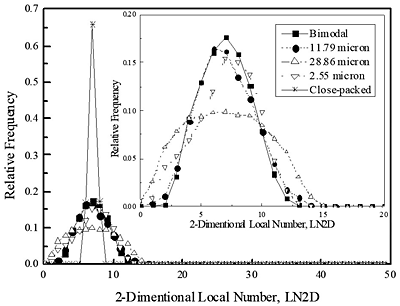
Figure 3 shows measured LN2D results of CF distribution in UD-CF/Al composites depending on added Cu sizes. The calculated relative frequency of LN2D for close-packed structure model are compared with the measured results. Their ‘average’ and ‘variance’ results of LN2D are listed in Table 1. The LN2D results on the close-packed structure model showed a sharp peak with the frequency average, LN2Dave of 7.00462 and extremely narrow frequency variance LN2Dvar of 0.340141. Note that if the measured LN2Dave and LN2Dvar of random CFs distribution in the composites are as close as the results of close-packed structure model, the distribution tends toward homogeneous. Altough the ‘LN2Dave’ did not have any distinguishable differences regardless of added Cu sizes even comparing to the close-packed structure model, the ‘LN2Dvar’ exhibited decisive difference. The composite also showed the widely-scattered LN2D frequency by relatively high frequency at the range below 5 or above 10 as shown in Fig. 3. Those LN2D results are obviously caused by the wide local fiber clustering region and the adjacent wide matrix region containing few fibers. Such polarization of CF distribution leading to density decrease of the composite was caused by insufficient infiltration of molten Al into clustered fibers of UD-CF preform. It means that adding unsuitable Cu size in UD-CF preform affected LN2Dvar with fiber clustering in the composite. Except of the composites added with 28.86 µm Cu particles, all of the composites exhibited concentrated LN2D frequency around 7. Two composites with each 2.55 and 11.79 µm Cu particles did not show big distinction on LN2Dvar, but their porosities were different. The composite with 11.79 µm Cu has about 10 % porosity, whereas the composite with 2.55 µm Cu was higher porosity than even the composite with 28.86 µm Cu. Small Cu spacing in the fiber clustering region shown in Fig. 1 (a) is expected to lower the LN2Dvar values of theccomposite. However, those spaces did not have enough area to infiltrate molten Al because of poor-wettability between carbon and molten Al. That is, the delicate difference of LN2Dvar between the composites added with each 2.55 and 11.79 µm Cu particles can be sensitive turning-point whether having adequate fiber spacing for molten Al infiltration or having insufficient fiber spacing as clustering which causes imperfect infiltration easily. Moreover, the addition of 11.79 µm Cu particles was effective to uniform fiber distribution. In other words, the UD-CF/Al composites with LN2Dvar below 5.4 exhibits high density restraining detrimental fiber clustering when the fiber volume fraction is 0.3. The composite added bimodal size of Cu particles showing lowest LN2Dvar of 4.2612 exhibited lowest porosity of 5 % and extremely rare fiber clustering. From these results, LN2D analysis from the cross-sectional SEM images can be a simple and effective way for the quantification of fiber distribution contributing to the densification of UD-CF/Al composites. It is expected that such LN2D analysis for fiber distribution can be widely applied on the optimization of fabrication conditions for high performance MMCs.


