In recent years, aluminum alloy sheets are used for the bodies of some automobiles to reduce the weight. It is known that the formability of sheet steel commonly used as the body consists of four basic deformation components: deep drawability, stretch formability, stretch-flange formability and bendability. Among them, deep drawability and bendability are strongly affected by crystallographic orientations and consequently depend on textures of polycrystalline metal sheets.
As for the body of an automobile, since outer panels of the hood, trunk-lid and doors require hemming which corresponds to 180°-bending, good bendability is necessary as the outer panels. Takeda et al. showed that there was a negative correlation between the bendability on a plane strain condition and the Taylor factor on the basis of experimental results of Al-Mg-Si alloy single crystals with various orientations. Thus, it is clear that bendability is correlated with the Taylor factor and the orientation with a lower Taylor factor results in better bendability. When considering sheet metal formability in the body of automobiles, sheet materials with good deep drawability are necessary for door inner panels and fenders which require forming the sheets into complex components. Lankford value (r-value) as an indicator of deep drawability, however, has a considerably low value in normally rolled and annealed aluminum alloy sheets as compared to in steel sheets. Therefore, the r-value which strongly depends on orientation should be improved through texture control. The authors recently succeeded the evolution of recrystallization texture consisting mainly of {111}<110> orientations favorable for improving the r-value. Texture control requires predicting in-plane anisotropy of the r-value with high accuracy. In the present study, the average Taylor factor of a polycrystalline material was calculated through texture analysis by an orientation distribution function (ODF). Then the anisotropic features of the normalized Taylor factor and the r-value as respective criteria of bendability and deep drawability were predicted simultaneously.
If we use the tensile specimen cut along an arbitrary direction to the rolling direction in a sheet, then the average Taylor factor in the specific direction is given by the following equation using the angle θ to the rolling direction.
 |
(1) |
The coefficients ![]() (q) are determined by calculating the Taylor factor M(q,g) at a given q-value in the form of series-expansion by generalized spherical harmonics
(q) are determined by calculating the Taylor factor M(q,g) at a given q-value in the form of series-expansion by generalized spherical harmonics ![]() (g). The coefficients
(g). The coefficients ![]() of the ODF are calculated from some pole figures on different crystal planes measured by X-ray diffraction. Assuming that as the Taylor factor lowers, i.e. as the total amount of glides becomes smaller, it is more difficult for shear bands to form, the average Taylor factor of a polycrystalline material was calculated from the ODF. In bending deformation, the q-value which represents a ratio of transverse to longitudinal strain corresponds to a ratio of compressive strain along the bending axis to tensile strain along the bending direction on the side subjected to tensile stress. When an outer side (a convex side) in bending deformation satisfies the condition of plane strain tension, the q-value equals zero. In fact, the q-value is considered to be a little larger than zero on the sheet surface subjected to the maximum tensile stress when the width of a bending specimen is relatively small. An in-plane variation of the average Taylor factor can be given by the graph showing a relationship between θ and M(q,θ) under a fixed q-value in Eq. (1). To quantitatively relate the average Taylor factor to bendability, we further calculate the average Taylor factor for a textured sheet material M(q,θ) divided by the Taylor factor for a randomly oriented sample
of the ODF are calculated from some pole figures on different crystal planes measured by X-ray diffraction. Assuming that as the Taylor factor lowers, i.e. as the total amount of glides becomes smaller, it is more difficult for shear bands to form, the average Taylor factor of a polycrystalline material was calculated from the ODF. In bending deformation, the q-value which represents a ratio of transverse to longitudinal strain corresponds to a ratio of compressive strain along the bending axis to tensile strain along the bending direction on the side subjected to tensile stress. When an outer side (a convex side) in bending deformation satisfies the condition of plane strain tension, the q-value equals zero. In fact, the q-value is considered to be a little larger than zero on the sheet surface subjected to the maximum tensile stress when the width of a bending specimen is relatively small. An in-plane variation of the average Taylor factor can be given by the graph showing a relationship between θ and M(q,θ) under a fixed q-value in Eq. (1). To quantitatively relate the average Taylor factor to bendability, we further calculate the average Taylor factor for a textured sheet material M(q,θ) divided by the Taylor factor for a randomly oriented sample ![]() (q), which is defined as the normalized Taylor factor (the Mn value).
(q), which is defined as the normalized Taylor factor (the Mn value).
| (2) |
Since the r-value is a strain ratio of width and thickness directions in a tensile specimen, the r-value can be expressed by the following equation using the strain ratio q-value.
| (3) |
The average Taylor factor M(q,θ) can be calculated using Eq. (1). Thus, the r-value can be determined by calculating the q-value at which the M(q,θ) meaning plastic work, becomes minimum at a fixed angle of θ. To compare the calculated results, the full constraints model suitable for the r-value prediction of Al-Mg-Si alloy sheets was used in the present study. Thus, it is possible to predict bendability and deep drawability by calculating the average Taylor factor M(q,θ) based on the ODF.
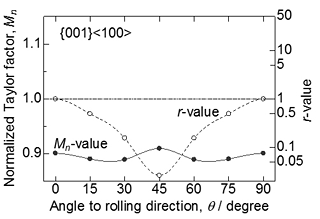
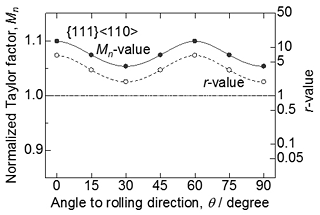
Figure 1 shows in-plane variations of the normalized Taylor factor Mn and the r-value for ideal cube orientations {001}<100> with Gaussian spread of 20°. Here the angle θ¸ means the bending direction perpendicular to a bend axis. The bendability of cube orientations can be estimated to be excellent in any direction. In contrast, the r-value shows a very low value at θ = 45° and the in-plane anisotropy is remarkable. The deep drawability of cube orientations are estimated to be poor. Ideal {111}<110> orientations have considerably higher Mn values, as shown in Fig. 2. The r-value shows a high value more than 1.5 in any direction. Thus, it is estimated for {111}<110> orientations that the bendability is poor but the deep drawability is excellent. The predicted results from {001}<100> and {111}<110> ideal orientations are useful for improving bendability and deep drawability, respectively.
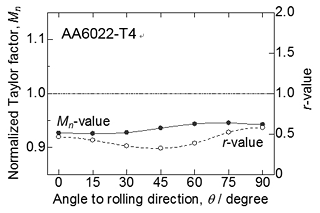
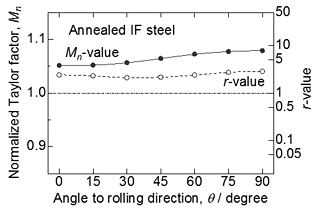
Figure 3 shows in-plane variations of the Mn value and the r-value for an AA6022 aluminum alloy sheet with T4 temper after 90% cold rolling. This sample shows moderately strong cube texture. The Mn value is relatively low and isotropic. The r-value as a whole shows considerably lower values than 1.0 and it has the lowest value at θ = 45° When ignoring the effect of ductility on sheet formability, this sheet probably has good bendability but poor deep drawability. Cold rolled and T4-treated sheets seem to be suitable for outer panels which requires hemming. Figure 4 shows in-plane variations of the Mn value and the r-value for a cold rolled and annealed IF steel sheet. Since the annealed IF steel has the γ-fiber (<111>//ND) texture favorable for deep drawability, the r-value shows very high values. However, the Mn-value is quite high. This suggests that the γ-fiber leads to excellent deep drawability but poor bendability. In general, low carbon steels show high ductility and have a number of glide systems. As a result, there is no problem in bending of low carbon steels. In the opposite sense, this implies that the bendability of high strength aluminum alloys with lower ductility are very important in view of texture.


