In Mg alloys with long period stacking ordered (LPSO) phase, it is known that kink deformation occurs in LPSO phase instead of twinning and non-basal slip. However, deformation behavior of LPSO-Mg extruded alloys was not investigated well. In this study, compression tests of two LPSO-Mg alloys with α-Mg phase and LPSO phase was conducted and AE signals were classified by machine learning. Additionally, AE signals for supervised learning were gathered from model alloys. According to AE classification and microstructure observation, deformation behavior was considered.
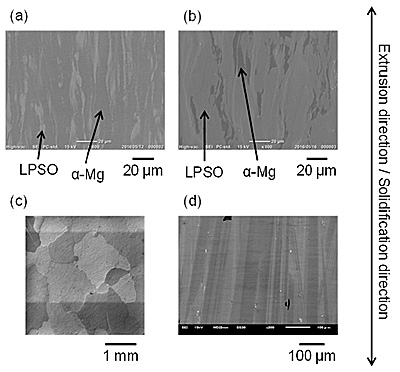
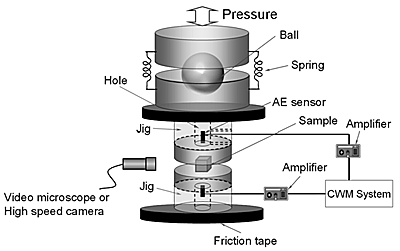
Two LPSO-Mg extruded alloys of Mg97Zn1Y2 and Mg89Zn4Y7 and two model alloys of pure Mg extruded alloy and Mg85Zn6Y9 directionally solidified (DS) alloy were prepared. The microstructure images of these alloys are shown in Fig. 1. Compression tests of all alloys were conducted at a displacement rate of 5.0 ![]() 10-4 mm/s at room temperature (Fig. 2). Two M304A AE sensors (Fuji ceramics, Japan) were used in the compression tests. The position of AE sensors are described in Fig. 2. AE signal was amplified by 55 dB (LPSO-Mg extruded alloys) or 15 dB (model alloys) and then recorded at 10 MHz sampling rate by CWM (Continuous Wave Memory) which was developed by our group. During the compression tests of model alloys, formation of deformation bands was observed.
10-4 mm/s at room temperature (Fig. 2). Two M304A AE sensors (Fuji ceramics, Japan) were used in the compression tests. The position of AE sensors are described in Fig. 2. AE signal was amplified by 55 dB (LPSO-Mg extruded alloys) or 15 dB (model alloys) and then recorded at 10 MHz sampling rate by CWM (Continuous Wave Memory) which was developed by our group. During the compression tests of model alloys, formation of deformation bands was observed.
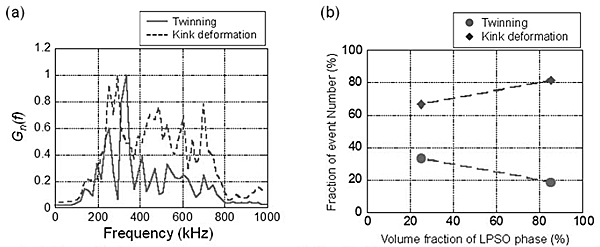
Figure 3 (a) shows deformation bands by twinning at the surface of pure Mg which was observed with the frame speed of 5,000,000 fps. The band indicated as (1) in Fig. 3 (a) showed three steps in its appearance and growth behavior. At first, band (1) with the length of ~0.6 mm appeared in 0.2 µs(the time of one frame). Secondary, band (1) grew at the constant speed for 0.6 µs. Finally, the length of band (1) increased slower than the second step for 5.0 µs and became ~1.2 mm. Also, band (2) appeared 1.2 µs later than band (1) and grew similarly to band (1). The other observed bands showed the similar behavior with three steps. Figure 3 (b) shows a deformation band by kink deformation at the surface of Mg85Zn6Y9 DS alloy which was observed with the frame speed of 5,000,000 fps. As training data of SVM, 8 and 15 AE events by twinning and kink deformation were gathered, respectively. Figure 4 (a) shows normalized average energy spectrum of AE events of each deformation mechanism in the frequency range of 0-1000 kHz. While AE event by kink deformation showed relatively high energy from 200 to 700 kHz, the peak can be seen clearly around 300 kHz in AE event by twinning. AE events of LPSO-Mg extruded alloys were classified. Figure 4 (b) shows the change of number fraction of AE events with respect to volume fraction of LPSO phase. From the results of microstructure observation and AE analysis, deformation behavior of Mg97Zn1Y2 and Mg89Zn4Y7 extruded alloys was considered. Figure 5 (a) shows the time course of twin area fraction and AE event rate in a compression test of Mg97Zn1Y2 extruded alloy. While twin area fraction started to increase at 1580 s, after the yield point, AE event rate was highest at the yield point and decreased to zero after 1580 s. Hence, it is thought that AE was mainly generated by twin nucleation, not twin growth. Deformation behavior of Mg97Zn1Y2 is mainly considered as followings: (1) Minor twinning and kink deformation before yielding (2) Frequent twinning and kink deformation at the yield point (3) Growth of twin and kink bands after yielding. Figure 5 (b) shows the change of number density of kink band and AE event rate in a compression test of Mg89Zn4Y7 extruded alloy.


