Since the discovery of quasicrystal (QC) in 1984, its unique properties have been revealed in terms of crystal structure and electrical properties. However, the question whether the semiconducting or insulating QCs exist or not has still been one of the fundamental problems of solid state physics, although the concept of the QC had been established as one of the categories of solid-state structure. The semiconducting QC has attracted attention not only from the academic interest but also from the viewpoint of application for thermoelectric (TE) materials realizing the direct conversion between thermal and electrical energies. The performance of a TE material can be evaluated by its dimensionless figure of merit zT = S 2σT/(κel + κlat), where S, σ, T, κel, and κlat are the Seebeck coefficient, electrical conductivity, absolute temperature, electronic thermal conductivity, and lattice thermal conductivity, respectively. The highest zT between QCs achieved so far is 0.26, which is only about a quarter of the general target value of unity, at 500K in an Al–Ga–Pd–Mn QC. The main problem is that the value of S (≈ 100µVK-1) is approximately a half that of typical practical materials. In order to obtain a sufficiently large S at a target temperature T, a semiconductor having a band gap of 6–10kBT, where kB is the Boltzmann constant, is usually required. Therefore, the discovery of semiconducting QC is necessary for the breakthrough of QCs as TE materials. In the present paper, we performed the orbital analysis of Al–Ir C-phase by means of DFT calculations to obtain a guideline to control the band gap. Following the obtained guideline, we found that the Al–Si–Ru C-phase is a promising candidate of a semiconducting QCA, and we experimentally synthesized a sample, which exhibits semiconducting TE properties.
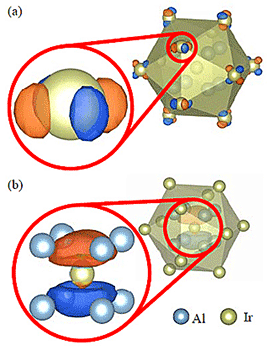
Our calculated model of Al-Ir C-phase (Al22Ir8 per unit cell) displayed in Fig. 1 visualized by VESTA3 is based on the experimental model of Al–Ni–Ru C-phase, which has less chemical disorder. Framework of the calculated model is composed of edge-sharing Ir12 icosahedral clusters, including an Ir@Al8 endohedral clusters referred to as the inner cluster hereafter. We note that the number of electrons of Al at the inner cluster was reduced to satisfy the same number of valence electrons as 10-phase (Al22Ir8 per unit cell) by using the virtual crystal approximation.
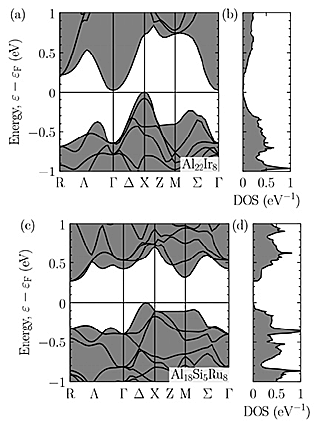
Figures 2(a) and (b) show the band structure and DOS of Al–Ir C-phase. The band structure has a extremely narrow band gap of 0.02eV which is consistent with previous calculation of the so called 10-phase. The conduction band minimum (CBM) and the valence band maximum (VBM) are located at Γ point and X point, respectively. As shown in Fig. 3, we have analyzed the corresponding Bloch states (Bloch orbitals) of the VBM and CBM of Al–Ir C-phase to find clues to enlarge the band gap, that is, shifting up (down) the CBM (VBM). The CBM consists of the Ir-d orbital at the vertices of icosahedral clusters. Therefore, the energy of the CBM can be shifted up by substituting an element having a higher d-orbital energy, e.g. Ru, for Ir. On the other hand, the VBM consists of p-like orbitals at the inner clusters. We note that these p-like orbitals should not be considered as the Ir-p orbitals but the p-orbitals of clusters composed of Ir and surrounding Al which is also confirmed in Al–Cu–Ir C2-phase. For shifting down the VBM, it is considered effective to substitute Al, which is the main constituent element of the inner clusters, with Si having a lower orbital energy. On the basis of these findings, it is suggested that the Al–Si–Ru C-phase is a promising candidate as the semiconducting QCA. A band structure calculation was performed for the model of Al–Si–Ru C-phase (Al18Si5Ru8 per unit cell). Figures 2(c) and (d) show the band structure and DOS of a hypothetical Al–Si–Ru C-phase (Al18Si5Ru8 per unit cell). A finite band gap of 0.27eV is confirmed, indicating that our strategy was effective to enlarge a band gap. The CBM and VBM changed from Γ and X to R and Δ, respectively. Since the VBM is located at Δ which has lower symmetry than X, many hole pockets are duplicated, leading to a band structure advantageous as a TE material.
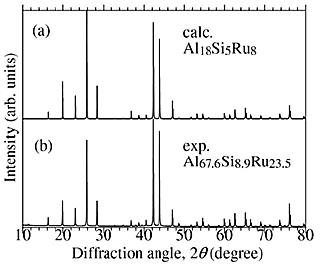
Although Al–Si–Ru C-phase was suggested as a semiconductor, there had been no reports about the phase diagram and formation of C-phase for the ternary Al–Si–Ru system. We have experimentally tried synthesizing the Al–Si–Ru C-phase in the vicinity of the composition Al18Si5Ru8 ≈Al58.1Si16.1Ru25.8, which is assumed in the DFT calculation. Figure 4 shows the XRD patterns of the Al67.6Si8.9Ru23.5 sample and the hypothetical Al18Si5Ru8 model, indicating that all of the diffraction peaks were indexed to the primitive cubic lattice of the lattice constant a = 0.77100(2)nm and no secondary phase was observed. The analyzed composition obtained by EDX is Al67.2(3)Si9.2(1)Ru23.6(3), which is almost the same as the nominal composition.
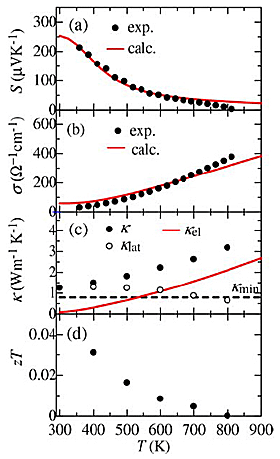
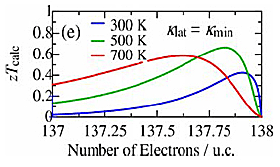
Figures 5(a)–(d) show S, σ, κ, and zT as a function of T for the sample. The S at 350K is more than 200µVK-1 and is nearly twice the value of 120µVK-1 for Al–Pd–Re–Fe icosahedral QC, which has been the highest value among QCs and QCAs reported so far. The value of S decreases with increasing T up to 800K. It can be due to the excitation of minority carriers (electrons). In Fig. 5(a), we also show calculated S assuming the number of holes per unit cell of 0.012, band gap of 0.15eV, and the electronic diffusion constant of 0.39cm2 s-1, which are also used to calculate σ and κel. The calculated S and σ are more consistent with the experimental ones than those calculated with constant relaxation time approximation. This situation is the same as the other QCAs. It indicates that the sample is a narrow-gap semiconductor with the band gap of 0.15eV. As shown in Fig. 5(b), σ exponentially increases with increasing T, which is a typical trend of intrinsic semiconductors. σ at 350K is about an order of magnitude lower than that of Al–Pd–Re QC, which has been thought to be closest to the semiconducting state so far. Figure 5(c) shows the T dependence of κ, κel (≡ LσT, where L is the effective Lorenz number), and κlat (≡κ–κel), where L is obtained by DFT calculation with the same condition as for S. κ increases with increasing T up to 800K because of the increasing of κel. The increasing trend of κel is expected to be due to not only the increasing σ and T but also the bipolar diffusion as the L has at most 5 times larger value than Wiedemann–Franz limit. The behavior of this bipolar diffusion is consistent with the reduction of S at high T. On the other hand, κlat exhibits low value of about 1.0Wm-1 K-1 at room temperature because of intrinsically complex crystal structure. Above room temperature, κlat decreases with increasing T and asymptotically approaches the theoretical minimum κmin ≈ 0.76n2/3kBvs = 0.8Wm-1 K-1, where n is the number of atomic density, based on diffuson-mediated thermal transport theory, which gives smaller value (about 60%) than a model proposed by Cahill et al. and could be valid for QCs and QCAs. Finally, we show the dimensionless figure of merit zT as a function of temperature in Fig. 5(d). zT monotonically decreases with increasing T. The maximum value of zT remained relatively low value of approximately 0.03 at 350K due to the low σ. Furthermore, we also show the calculated zTcalc as a function of the number of electrons per unit cell in Fig. 5(e) assuming κlat = κmin indicating that further enhancement is expected through the hole doping.
In summary, we predicted that the Al–Si–Ru C-phase is a semiconductor following the analyses of the CBM and VBM of Al–Ir C-phase and we successfully synthesized a sample of Al–Si–Ru QCA exhibiting semiconducting transport properties. This is the first experimental realization of the semiconducting quasicrystalline approximant. The present work could pave ways for break-through on the QC of thermoelectrics and the discovery of undiscovered semiconducting QC.

