In this paper, temperature dependence of creep life is discussed. Temperature dependence of creep rate and/or creep life is one of an important characteristics of creep behavior and creep life is frequently discussed by means of Larson-Miller (LM) and Sherby-Dorn (SD) parameters. They are widely used when formulating and predicting creep rupture life tr. The LM constant C and the activation energy Q in the SD parameter characterize temperature dependence of tr. The activation energy for lattice self-diffusion, QLSD and C of 20 are often assumed as typical value for the parameters. In this study, creep rupture datasets of 11 heats of nickel based alloy 617, 304H and 304J1 stainless steels, 6 heats of A3004N aluminum alloy and four Mg-Al alloys are formulated with the parameters for determining C and Q of each dataset. Based on the correlation between C and Q among similar materials, it is discussed what is the C value equivalent to Q = QLSD. It is also examined how the C values change with melting temperature of the materials. C is proportional to Q, but its coefficient is proportional to average reciprocal temperature of the dataset. It is concluded that the value of C equivalent to Q = QLSD is about 12, pointing out that C = 20 is not equivalent to Q = QLSD. The equivalent C values are similar in all the materials independently of their melting temperatures.
Creep and aging of a material are time dependent phenomena and their rate is controlled by diffusion of atoms in the material. In some cases, it takes very long time and prediction of long time behavior is required based on the results obtained by short time experiments. Long-term creep rupture life, for example, is predicted from short-term creep rupture data obtained experimentally. When predicting the life, one first formulates the short-term data with a time-temperature parameter (TTP), such as Sherby-Dorn (SD) PSD and Larson-Miller (LM) PLM parameters [1]:
| PSD = log tr - (Q/RT) log e = f (σ) | (1) | |
|
|
PLM = (log tr + C) T = f (σ) | (2) |
where tr is the creep rupture life in hour, Q is the activation energy, R is the gas constant, T is the absolute temperature, e is the Napier's constant, C is the LM constant, and f(σ) is a function of stress σ. The formula is extrapolated toward lower temperature for predicting long-term creep rupture life. Q and C play important roles in the extrapolation. It is known that a value of C = 20 was initially proposed, but optimized values between 10 and 40 have subsequently been found to be suitable depending on the material. One objective of this study is to investigate correlation between C and Q and physical bases of value of C. In this abstract, analysis of creep rupture of magnesium based and aluminum based alloys are briefly presented.
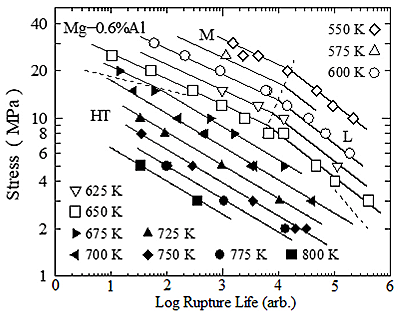
Creep rupture datasets of Mg-0.6, 1.0, 3.0 and 4.9at%Al alloys are taken as examples of low melting temperature materials. The alloys were hot extruded to rod around 190degree Celsius. Creep specimens were machined from the rods, and annealed at 527degree Celsius for 2 hours. Creep tests were conducted under a constant stress in air or argon gas. All the alloys were in solid solution during creep tests. Some creep properties of the alloys have been reported elsewhere [2,3]. Creep rupture lives of Mg-0.6at%Al alloy are plotted as a function of stress in Fig. 1. There are three regions M, L and HT with different values of n. The dataset is divided into the three sub-datasets M, L and HT. They are subjected to the regression analyses based on Eqs. (1) and (2). The analyses give three different regression lines for the three datasets. The shortest creep rupture life among the three lines is taken, and the life is drawn in the figure. The analyses give Q = 218 kJ/mol and C = 15.5 in the high temperature region HT, Q = 175 kJ/mol and C = 15.8 in the low temperature and short-term region M, and Q = 115 kJ/mol and C = 8.7 in the low temperature and long- term region L. Creep rupture datasets of the Mg-1, 3 and 4.9at%Al alloys show similar behavior to that of the Mg-0.6at%Al alloy.
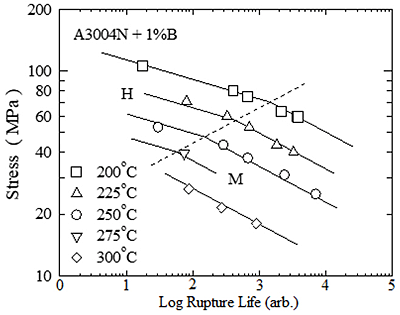
Aluminum alloys (three heats of A3004N alloy and three heats of A3004N+1%B alloy) are taken as other examples of low melting temperature materials. Their creep rupture data have been reported in literature [4] together with their chemical compositions, fabrication procedures and heat treatments. The A3004N alloy contains Cu (<0.4%), Mn (1.4-1.8%) and Mg (1.2-1.7%). Creep specimens were machined from extruded and stretched materials (H112), and subjected to creep tests without additional heat treatment. Creep tests were performed under constant load in air. Creep rupture lives of a heat of A3004N +1%B alloy are plotted against stress in Fig. 2. There are two regions H and M with different values of n in the figure. The dataset is divided into sub-datasets H and M, and the sub-datasets are subjected to the regression analyses based on Eqs. (1) and (2). The shorter creep rupture life between the two regression lines is also taken in the present case, and drawn in the figure. The regression lines fit very well to the data points. The analyses give Q = 262 kJ/mol and C = 23.9 in region H, and Q = 186 kJ/mol and C = 16.0 in region M. Boron is not in solid solution but forms coarse AlB2 particles. There is no essential difference in creep rupture strength between the two alloys with and without boron. All the heats of the two alloys show similar creep rupture behavior.
| Parts of conclusions in this study are as follows. |
|||
| 1. | Regression analyses based on Eqs. (1) and (2) give a pair of Q and C values for a creep rupture dataset. The two values are well correlated with following equation.
|
||
| 2. | C value equivalent to QLSD is about 12 in all the materials. The assumptions, Q = QLSD and C = 20 are not equivalent. |
| [1] | R. Viswanathan, Creep, in: Damage Mechanisms and Life Assessment of High Temperature Components, ASM Intern., Metals Park, OH, 1989, pp. 59-110. | |
| [2] | H. Sato, M. Koyama, H. Oikawa, Deformation characteristics of HCP Mg-Al solid solutions at 600-750K, in: K. Hirano, H. Oikawa, K. Ikeda (Eds.), Science and Engineering of Light Metals, Japan Institute of Light Metals, Tokyo, Japan, 1991, pp. 103-110. | |
| [3] | H. Sato, H. Oikawa, Transition of creep characteristics of HCP Mg-Al solid solutions at 600-650K, In: D.G. Brandon, R. Chaim, A. Rosen (Eds.), Strength of Metals and Alloys, Freund Publishing House, London, UK, 1991, pp. 463-470. | |
| [4] | J. Shimojo, K. Umehara, A. Oishi, H. Taniuchi, T. Nakayama, Development of extruded borated aluminum material for basket of transport/storage casks, In: Proceedings of 16th International Symposium on the Packaging and Transportation of Radioactive Material (PATRAM), 2010. |

