Mean free path of dislocation motion have a significant effect on mechanical properties because dislocation motion is blocked by eutectics and intermetallics in Al-Si casting alloys. In this study, we proposed a statistical method to evaluate mean free path of dislocation motion by using image processing, and investigated relation between the measured mean free path and mechanical properties of Al-Si casting alloys.
Figure 1(a) shows a typical microstructure of Al-Si casting alloy, and the photographic image was converted to a binary image by threshold image processing, as shown in Fig. 1(b). Image mean free path (IMFP), was measured by following procedures. (1) A staring point A in aluminum matrix and a traveling direction are selected randomly, as shown in Fig. 1(b). (2) A free path length, a, between the starting point in aluminum matrix and encountered silicon eutectic is measured (solid arrows), but measurement starts again from procedure (1) when some edge of image is found (dashed arrows). Procedure (1) and (2) were repeated at least one million times, and IMFP was calculated by averaging free path length, a.
Figure 2(a) shows IMFP which was measured in circles with changing the radius of circles. Relative frequency distribution of free path length with the circle of 100 pixel radius are shown in Fig. 2(b). Average of free path lengths was calculated. The average of the circle of 100 pixel radius was 84.8986 pixel. The radius of circle were varied form 50 pixel to 150 pixel with 10 pixel step, and IMFPs were calculated. From this analysis, D = 2.35575 ![]() r was derived, where r is IMFP and D is diameter of a circle. From this relation, equivalent circle diameter of aluminum matrix can be estimated from IMFP.
r was derived, where r is IMFP and D is diameter of a circle. From this relation, equivalent circle diameter of aluminum matrix can be estimated from IMFP.
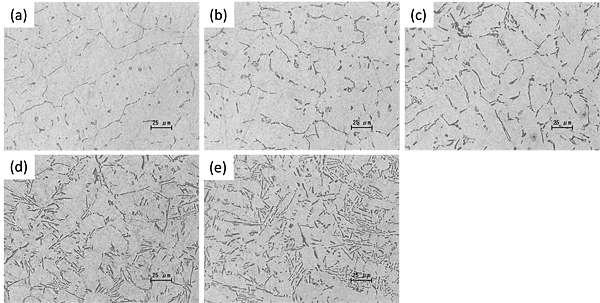
Figure 3 shows optical microstructures of Al-Si casting alloys. Amount of silicon content in mass percent were varied from 2% to 10%. Amount of eutectic silicon increases with increasing amount of silicon content and distances between eutectic silicon parts become closer and closer.
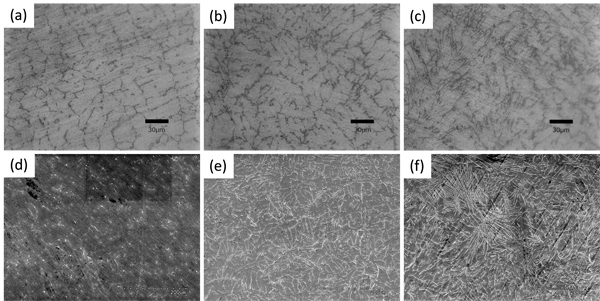
Figure 4(a) to (c) shows optical microstructures of Al-xSi-Fe casting alloys. Amount of iron content in mass percent were varied from 0.2% to 1.5%. Distances between eutectic silicon parts become closer and closer with increasing iron content. Fig. 4(d) to (f) shows SEM microstructures of Al-xSi-Fe casting alloys. Needle-like participates, Al5FeSi, are clearly identified in Fig. 4(f).
Figure 5(a) shows the relative frequency distribution of the free path lengths measured from Al-Si optical microstructure. Solid line represents the relative frequency obtained from microstructures of Al-2%Si. Relative frequency of short free path is lower than others and shape of the distribution is broader than others. Dashed-two dotted line represents the relative frequency of Al-12%Si. Relative frequency of short free path is higher than others. Lengths of the free path are averaged and IMFP for each distribution are obtained. Figure. 5(b) shows the relationship between silicon content and IMFP. IMFP decreases with increasing silicon content. Figure. 5(c) shows the relationship between iron content and IMFP. IMFP decreases with increasing iron content.
Figure 6 shows plots of r-1/2 versus mechanical properties, where r is IMFP. In Al-Si and Al-xSi-Fe, r decreased with increasing amount of additive elements, and the mechanical properties are proportional to r-1/2 (Hall-Petch relation or inverse Hall-Petch relation). Slopes of lines in Fig. 6 indicate degree of impact of each additive element on mechanical properties. If the slope is steeper, the impact on mechanical properties is larger. For example, elongation of Al-xSi-Fe is rapidly deteriorated with increasing amount of iron content, as shown in Fig. 6(c). This deterioration is thought to be caused by needle-like participates, Al5FeSi. With this kind of analysis, one can estimate the impact of additive elements on mechanical properties easily.
Table. 1 shows results of Vickers hardness test. Values are almost same in Al-xSi series. In other words, hardness of aluminum matrix are almost constant regardless of silicon content. Hardness of Al-xSi-Fe series are slightly higher than that of Al-xSi series, however, hardness of aluminum matrix are almost constant regardless of iron content. Specific relationship between mechanical properties and IMFP are shown in Fig. 6. This is attributable to constant hardness of aluminum matrix.