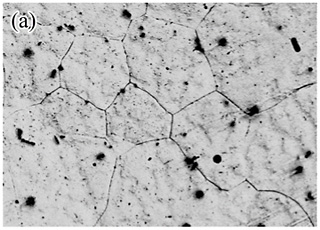
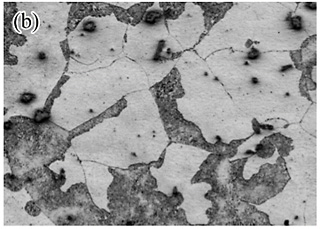
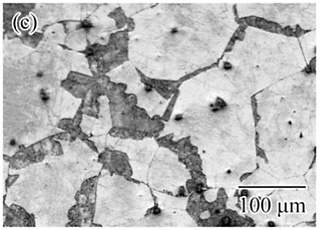
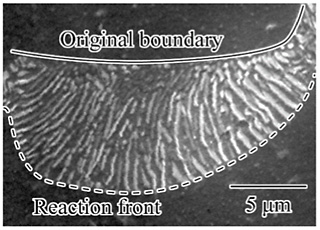
The effects of addition of Zn on the discontinuous precipitation (DP) behaviour have been metallographically examined in AM90 (AM) and AZ91Mg (AZ) alloys aged at 423, 448 and 473 K. Figures 1 show the optical micrographs of (a) an AM90Mg (AM) alloy specimen solutionized at 708 K for 24 h, (b) an AM alloy specimen aged at 473 K for 8 h after solutionizing, and (c) an AZ91Mg (AZ) alloy specimen aged at 473 K for 8 h after solutionizing. In the both alloys, the formation of DP cells along the boundaries were observed. Figure 2 shows a SEM image of a DP cell in an AM alloy aged at 423 K for 32 h. The DP cell consists of the lamellae of β-Mg17Al12 precipitates and α-Mg matrix phase. Figure 3 depicts the age-hardening curves of AM and AZ alloys aged at 473 K after solutionizing. The white and black markers indicate the hardness within grains (CP) and discontinuous precipitation cells (DP). Prior to the occurrence of a significant age-hardening within grains, DP cells in the alloys nucleate at grain boundaries and grow into the grains ahead of reaction fronts.
The width of the DP cells were measured with aging time t. The results are shown in Fig. 4. Here, the DP cell width L for the AM and AZ alloys were plotted against t during aging at 423, 448 and 473 K. The boundaries migrate at a constant rate at the early stage of aging, and then the growth rates of the DP cells gradually decrease and are eventually levelled off. For both alloys, the cell growth rate and average inter-lamellar spacing increase with aging temperature. It should be noted in Fig. 4 that the cell growth rates for the AM alloy are slightly faster than those for the AZ alloy. While, the incubation periods to initiate DP are nearly identical for the alloys. Kinetics analyses of DP using the model of Turnbull, and that of Petermann and Hornbogen have been conducted to estimate the grain-boundary diffusion data. The obtained activation energies Qb of boundary diffusion are 76 to 98 kJ/mol, depending on the models and the alloys. These values of Qb are well agree with the activation energy for boundary diffusion of Al in Mg.
Figure 5 shows the aging time dependence of the area fraction of DP cells in AM and AZ alloys during aging at 473 K. The area fraction of DP cells in the AZ alloy at the over-aging stage is smaller than that in the AM alloy at the same stage. To clarify the origin of difference in the area fraction in both the alloy, size l and number density Np of continuous β-Mg17Al12 precipitates in AM and AZ alloys peak-aged at 423, 448 and 473 K were investigated. The obtained results were summarized in Table 1. The size of β-precipitates within the matrix in the both alloys are nearly identical. On the other hands, number density of the precipitates in the AZ alloy is larger than that in the AM alloy. It is well-known that the continuous precipitation inhibits the DP reactions, due to decrease in the supersaturation of solutes or preventing the boundary migration. Therefore, the smaller area fraction in the AZ alloy is ascribed to the higher number density of continuous β-Mg17Al12 precipitates which successively suppress the boundary migration.