Influence of severe plastic deformation at cryogenic temperature on grain
refinement and softening of pure metals: Investigation using high-pressure torsion
K. Edalatia,b, J.M.Cubero-Sesina,b, A. Alhamidia,b, I. F. Mohameda,b, Z. Horitaa,b
aDepartment of Materials Science and Engineering, Faculty of Engineering, Kyushu University,
Fukuoka 819-0395, Japan
bWPI, International Institute for Carbon-Neutral Energy Research (WPI-I2CNER), Kyushu University,
Fukuoka 819-0395, Japan
Several metals were severely deformed at cryogenic temperature in liquid nitrogen and at room temperatures in air using high-pressure torsion (HPT). Extra grain refinement to the nanometer level and extra hardening were achieved after cryogenic-HPT in niobium (Fig. 1), which has a high melting temperature. In copper, which has a moderate melting temperature, nanograins formed during cryogenic-HPT but self-annealing, i.e., abnormal softening and grain coarsening to the micrometer level, occurred within a few hours after the cryogenic-HPT (Fig. 2(a) and (b)). In low-melting-temperature metals such as zinc, magnesium and aluminum, cryogenic-HPT led to extra softening and/or formation of coarser grains because of enhanced static recrystallization (Fig. 3). The effect of impurities on grain size, hardness-strain behavior and self-annealing was also studied after cryogenic-HPT (Fig. 2(a) and (b)).
[Published in Materials Science and Engineering A, 613 (2014), pp. 103-110]
 |
 |
| Fig. 1 Vickers microhardness plotted against shear strain for Nb (99.9%) processed by HPT at 100 K and 300 K after various numbers of turns, including hardness levels after annealing. |
|
Fig. 2 Variations of Vickers microhardness with holding time at 300 K after processing of (a) Cu (99.99999%) and (b) Cu (99.99%) by HPT at 100 K for 5 turns. Hardness levels were measured at 0.1, 1, 2, 3 and 4 mm away from disc center, corresponding to shear strains of 4, 40, 80, 120 and 160, respectively. |
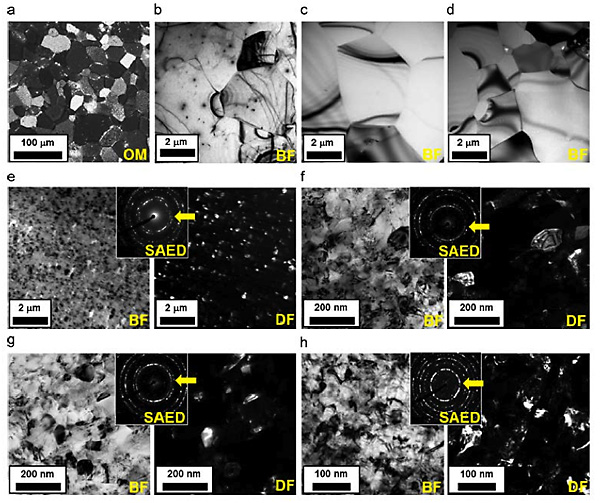 |
Fig. 3 Optical micrograph (OM), TEM bright-field (BF) and dark-field (DF) images including SEAD patterns for (a) Zn (99.99%), (b) Mg (99.9%), (c) Al (99.999%), (d) Al (99.99%), (e) Al (99%), (f) Cu (99.99999%), (g) Cu (99.99%) and (h) Nb (99.9%) processed by HPT at 100 K to steady states. Dark-field images in (e-h) were taken with diffracted beams indicated by arrows in SAED patterns. Cu samples were examined within 1 h after HPT. |