Creep tests were performed at less than 0.4 Tm for 99.999, 99.57 and 99.52% aluminum with several grain sizes in the range of 50-330 µm. These Al materials show remarkable creep behavior with an apparent activation energy (Q) of 30 kJ/mol, a stress exponent of 4, and a grain-size exponent of zero, and with a larger creep rate with increasing purity. These parameters resemble those of conventional dislocation creep, which is rate-controlled by the usual diffusion processes, except for the extra-low Q value. This means that a non-diffusional process affects the steady state deformation in this temperature region. Transmission electron microscopy revealed the development of a cell structure in the steady state and dislocations without any tangles in the cell interiors. Therefore, because the rate- controlling process could not occur inside of the cells, dislocation annihilation occurred through cross slip around the cell walls. According to these creep parameters and microstructural observations, the observed creep region is suggested to be a new creep region occurring through a non-diffusional process within the existing deformation mechanism map of Al at less than 0.4 Tm.
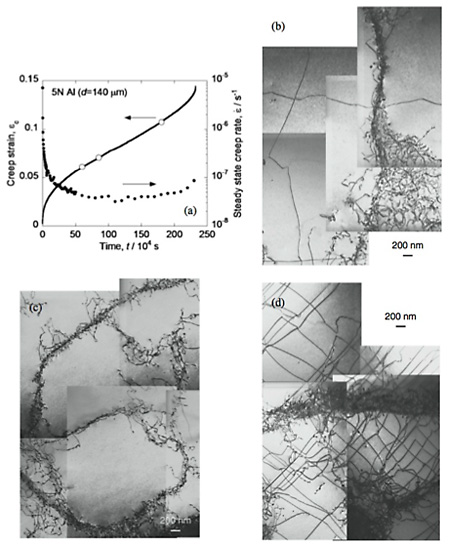
The samples used in this study were virgin rolled Al sheets of well-characterized 5N Al and two kinds of 1050 Al: 5N Al with d = 140 µm, 99.57% (1050a) Al and 99.52% (1050b) Al. Creep tests were conducted under tension using a dead-load creep frame at 300-523 K. Figure 1 shows strain rate and strain plots of the rupture creep data obtained for 5N Al under 25 and 30 MPa at 300 K using eddy-current displacement meters. Up to the minimum creep rate, the experimental data (circles) are in good agreement with the fitting curves (solid and broken lines) which were obtained using the data up to 4 x 10⁵ s, as shown by the arrows. Next, transmission electron microscopy (TEM) was performed for 5N Al after creep tests conducted at 30 MPa for given times.
The creep data are presented in a double logarithmic plot of strain rate and stress at various test temperatures in Fig.3. The n values of 5N Al and 1050a Al are evaluated as about 4 at low temperatures and as about 6 at high temperatures. The value at high temperature is close to that of the low-temperature dislocation creep region reported by Frost and Ashby, and the value at low temperatures closely corresponds to those reported in our previous letter and also to those reported by Ishikawa et al.
The new low-temperature creep has an outstanding low Q value. Figure 5 shows Arrhenius plots of 5N Al and 1050a Al at temperature range of 300-523 K. This figure shows two energy regions: a low-energy region corresponding to the new low- temperature creep region with Q = 30 kJ/mol, and a high- energy region with Q = 80 kJ/mol corresponding to the low-temperature dislocation creep region controlled by dislocation-core diffusion. The extra-low Q values of the new low-temperature creep means that diffusion processes are not necessary to accommodate an internal stress. Therefore, despite the two grades of Al contain different amount of impurities, they show the same creep behavior with a rate-controlling process, which is different from that of the conventional creep mechanism.
The above experiments suggest that the new low-temperature creep is a dislocation creep (n = 4) and that the dominant deformation occurs in the grain interiors (p = 0). Therefore, to reveal the deformation mechanism of this creep in detail using 5N Al, TEM observations were conducted after creep tests under 30 MPa at 300 K performed for given periods. Figure 6(a) shows the creep strain (left scale) and strain rate (right scale) curves with open circles representing the observation points at the beginning, middle and end of the steady state creep region.
At the beginning of the creep with a creep strain of 0.06, Fig. 6(b) shows that the cell structure had not developed well and that the dislocation density varied within a grain. In the middle of the steady state creep region, Fig. 6(c) shows that the cell walls had become clear and that the dislocation density inside of each cell was lower than in Fig. 6(b). These images show that the cell structure developed and that the cell size decreased gradually as creep proceeded. In addition, at the end of the steady state creep region, Fig. 6(d) indicates that cell structure had begun to collapse and that some dislocations had broken away from the cell walls, leading to rupture.
Based on the creep parameters, the new creep seems to be dislocation creep. Furthermore, TEM observations revealed that the creep is rate-controlled by recovery, because dislocations were not distributed homogeneously in the steady state, similarly to being observed in solute-strengthened Al alloys. Therefore, it is considered that the new creep is rate-controlled by a non-diffusional process that occurs not in the cells but at the cell walls. In these circumstances, cross slip is a possible mechanism for accommodating piled-up dislocations.
Finally, the deformation mechanism map of 5N Al with d = 140 µm is modified as depicted in Fig. 9, from (a) the hitherto known deformation mechanism map to (b) the modified one. It is noted that Fig. 9(b) is modified from the reported one using the slightly different creep parameters obtained in this study. Furthermore, the region for a strain rate of less than 10-10 s-1 is darkened because it is outside the region of direct measurement for the creep experiments in the map.
To elucidate the low-temperature creep deformation mechanisms of Al, creep tests were performed for 5N Al and two kinds of 1050 Al at 300-523 K. In addition, microstructural observations were conducted to reveal the dislocation structure for the new low-temperature creep. Detailed conclusions related to the new creep region, observed in 5N Al and 1050a Al are listed below:
(1) Same creep behavior was observed in the two grades of Al with a larger creep rate with increasing purity. It means that the impurity atoms suppressed the dislocation motion under the creep condition.
(2) The n value was 4 in the new low-temperature creep region. However, it became 6, which is close to that of the low-temperature dislocation creep region at higher temperatures.
(3) The new creep region is independent of the grain size because the p value does not appear.
(4) Diffusion processes are not activated in the new low- temperature creep region, because of an extra-low apparent activation energy of 30 kJ/mol. Luthy et al., however, overestimated the Q value at low temperatures because they used data in the power-law breakdown region.
(5) The cell structure developing during the creep was shown. The observed behavior implies that the rate- controlling process is cross slip at the cell walls.
(6) The new low-temperature creep region was added to the conventional deformation mechanism map of Al.
The authors appreciate funding support from Toyal Light Metal Mirai Foundation, Inc.