Porous aluminum has good lightweight property and high energy absorption ability. Due to these superior properties, porous aluminum can be a good shock absorber. The collapse behavior and shock absorbing property of porous aluminum is desired to be optimized by the pore structure. In this study, to unravel the collapse mechanism, the authors have utilized the image-based finite element analysis.
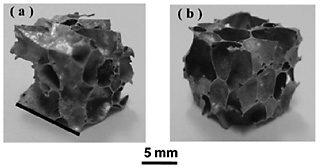
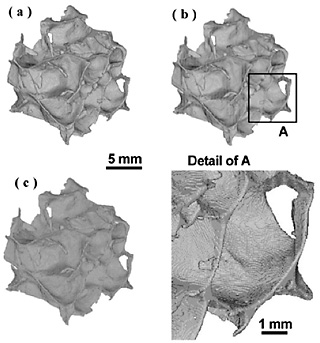
Figure 1 shows porous aluminum compression specimens (specimens A and B) of analysis models. Each specimen was scanned by a microfocus X-ray computed tomography (CT) system, and the finite element models were automatically and easily generated by using the uniform cubic element, that is, voxel element. As examples of finite element model, Figs. 2(a)-2(c) show three cubic element models with element sizes of 1 voxel of 2 voxel, 1 voxel and 1/2 voxel (1 voxel=0.031056 mm) for specimen A respectively. It can be seen that these models are formed by small cubic elements. Elastic finite elements analyses for two models (specimens A and B) were carried out under the forced compressive displacement of 0.1 mm. As material constants, Young's modulus E=68.1 GPa and Poisson's ratio v=0.3.The reconstruction of finite element models and the finite elements analyses are conducted using VOXELCON image-processing software (Quint Corporation, Japan). To reduce the numerical stress concentration due to the stepped surface of cubic element model, the smoothing processing was applied to the calculated stresses. Figure 3 shows the relationship between maximum Mises equivalent stress σVMmax and element size. As examples of stress distributions, Figs. 4(a) and 4(b) show distributions of Mises equivalent stress σVM before and after smoothing for the cubic element models with element size of 1 voxel of specimen A. As shown in Fig. 3, high value of σVMmax at local and narrow region can be evaluated when element size is small. In Fig. 4(a) before smoothing, wavy stress distribution, in which high stress and low stress alternately appear, was observed due to the stepped surface. However, in Fig. 4(b), high stress and low stress are canceled by the smoothing processing and the smooth stress distribution can be obtained. In Table 1, nominal Young's modulus Ea evaluated by elastic finite element analysis and experimental nominal Young's modulus Ee for specimen A are shown. The values of Ea by finite element analyses were approximately 18 times larger than the values of Ee. This is mainly because the plastic deformation (influence of yield) cannot be considered in elastic finite elements analysis.
Elastic-plastic large-deformation analyses were carried out for the cubic element models with element size of 1 voxel of specimen A. The half-size cubic element model of 150 voxel![]() 150 voxel
150 voxel![]() 150 voxel was newly reconstructed by cutting from center part of the cubic element model for elastic finite elements analysis (cf. Fig. 1(a)). Data of cubic element model was exported to ANSYS and the analyses under the forced compressive displacement of 0.05 mm were conducted using finite element analysis software ANSYS (ANSYS Japan). As material constants, Young's modulus E=68.1 GPa, Poisson's ratio v=0.3 and Yield stress (proportional limit) σys=11.6 MPa. As strain hardening curve, the relationship between yield true stress and logarithmic plastic strain for pure aluminum A1100-O was used. In this analysis, the smoothing processing was not applied because the relaxation of stress concentration was expected due to the influence of yield. Figure 5 shows the relationship between nominal stress and nominal strain evaluated by the elastic-plastic finite element analysis.
From this figure, it is found that the influence of yield appears in the very early stage. The initial gradient of the stress-strain curve Ep is 105.9 MPa and approximately the same as the value by experiment (Ee=101 MPa). Figure 6 shows the distribution of σVM when nominal strain
150 voxel was newly reconstructed by cutting from center part of the cubic element model for elastic finite elements analysis (cf. Fig. 1(a)). Data of cubic element model was exported to ANSYS and the analyses under the forced compressive displacement of 0.05 mm were conducted using finite element analysis software ANSYS (ANSYS Japan). As material constants, Young's modulus E=68.1 GPa, Poisson's ratio v=0.3 and Yield stress (proportional limit) σys=11.6 MPa. As strain hardening curve, the relationship between yield true stress and logarithmic plastic strain for pure aluminum A1100-O was used. In this analysis, the smoothing processing was not applied because the relaxation of stress concentration was expected due to the influence of yield. Figure 5 shows the relationship between nominal stress and nominal strain evaluated by the elastic-plastic finite element analysis.
From this figure, it is found that the influence of yield appears in the very early stage. The initial gradient of the stress-strain curve Ep is 105.9 MPa and approximately the same as the value by experiment (Ee=101 MPa). Figure 6 shows the distribution of σVM when nominal strain ![]() n=0.0107 evaluated by the elastic-plastic finite element analysis with element size of 1 voxel. The value of σVMmax was approximately 100 MPa and high stress concentration appeared around small holes and in thin pillar parts of the cell walls.
n=0.0107 evaluated by the elastic-plastic finite element analysis with element size of 1 voxel. The value of σVMmax was approximately 100 MPa and high stress concentration appeared around small holes and in thin pillar parts of the cell walls.
From these results, it was concluded that the compressive collapse behavior was affected by the elastic-plastic property of material along with the high stress concentration in cell wall from the very early stage of the compression and the plateau region was realized by the finite deformation of the cell walls.