Accumulative roll bonding (ARB) is one of the severe plastic deformation processes. Recently, it
has been reported that {4 4 11} ![]() 11 11 8
11 11 8![]() orientation (Dillamore orientation) developed in ARB processed sheets in A1100, A3103, A5083 and A8011 and so on. In the present study, a {001}
orientation (Dillamore orientation) developed in ARB processed sheets in A1100, A3103, A5083 and A8011 and so on. In the present study, a {001}![]() 100
100![]() oriented aluminum single crystal was deformed by nine cycles of accumulative roll bonding which corresponded to a total equivalent strain of
oriented aluminum single crystal was deformed by nine cycles of accumulative roll bonding which corresponded to a total equivalent strain of ![]() =7.2. The formation of {4 4 11}
=7.2. The formation of {4 4 11} ![]() 11 11 8
11 11 8![]() component in
deformation texture was examined by using electron back-scatter diffraction method.
component in
deformation texture was examined by using electron back-scatter diffraction method.
A (001) [100] single crystal sheet was fabricated from a 99.99% aluminum ingot by the modified Bridgman method. The sheet was cut into specimens with dimensions of 4 mm (thickness) ![]() 16 mm (width)
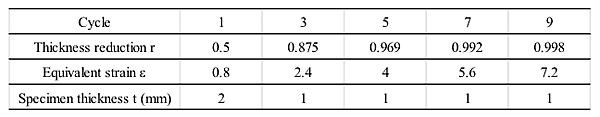
16 mm (width) ![]() 60 mm (length). The single-crystal specimens were deformed by a two-high rolling mill at room temperature with lubrication. Table 1 shows the thickness reduction, equivalent strain and specimen thickness in each ARB cycle. Conventional rolling was carried out in the first and second cycles, and ARB was performed from the third cycle. Each cycle of the ARB process included cutting, stacking, and rolling procedures. After each ARB cycle, EBSD measurements were performed at a step size of 1
60 mm (length). The single-crystal specimens were deformed by a two-high rolling mill at room temperature with lubrication. Table 1 shows the thickness reduction, equivalent strain and specimen thickness in each ARB cycle. Conventional rolling was carried out in the first and second cycles, and ARB was performed from the third cycle. Each cycle of the ARB process included cutting, stacking, and rolling procedures. After each ARB cycle, EBSD measurements were performed at a step size of 1![]() m by using a field-emission scanning electron microscope. The observation area was parallel to the rolling direction (RD) and the normal direction (ND) axes. The thickness location X was defined in terms of the specimen thickness t. X=0 corresponds to the upper surface. The layers at X = 0t
m by using a field-emission scanning electron microscope. The observation area was parallel to the rolling direction (RD) and the normal direction (ND) axes. The thickness location X was defined in terms of the specimen thickness t. X=0 corresponds to the upper surface. The layers at X = 0t![]() 0.25t, X = 0.25t
0.25t, X = 0.25t![]() 0.75t, and X = 0.75t
0.75t, and X = 0.75t![]() 1t are called upper surface layer, center layer, and lower surface layer, respectively.
1t are called upper surface layer, center layer, and lower surface layer, respectively.
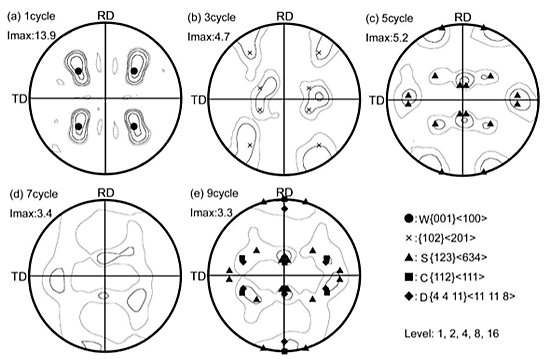
Figure 1 shows {111} pole figures of the center layers after one to nine cycles. The crystal rotation
from {001} ![]() 100
100![]() to {102}
to {102} ![]() 201
201![]() occurred in the range from one to three cycles. From three to five
cycles, {102}
occurred in the range from one to three cycles. From three to five
cycles, {102} ![]() 201
201![]() orientation rotated toward four variants of {123}
orientation rotated toward four variants of {123} ![]() 634
634![]() orientation. The specimen
after nine cycle developed the deformation texture consisted of {123}
orientation. The specimen
after nine cycle developed the deformation texture consisted of {123} ![]() 634
634![]() , {112}
, {112} ![]() 111
111![]() and {4 4 11}
and {4 4 11}
![]() 11 11 8
11 11 8![]() orientations. The maximum intensity of the texture was 3.3.
orientations. The maximum intensity of the texture was 3.3.
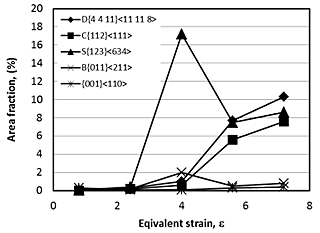
Figure 2 shows the change in the area fractions of texture components. {123} ![]() 634
634![]() orientation
increased its area fraction in the range from three to five cycles. The area fraction of {123}
orientation
increased its area fraction in the range from three to five cycles. The area fraction of {123} ![]() 634
634![]() was
17.2% after five cycles. Between five and seven cycles, the area fraction of {123}
was
17.2% after five cycles. Between five and seven cycles, the area fraction of {123} ![]() 634
634![]() decreased,
while those of {112}
decreased,
while those of {112} ![]() 111
111![]() and {4 4 11}
and {4 4 11} ![]() 11 11 8
11 11 8![]() orientations increased. After nine cycles, the area
fraction of {4 4 11}
orientations increased. After nine cycles, the area
fraction of {4 4 11} ![]() 11 11 8
11 11 8![]() , {123}
, {123} ![]() 634
634![]() , and {112}
, and {112} ![]() 111
111![]() were 10.3%, 8.6%, and 7.6%,
respectively. Judging from the area fractions, the main component of the texture is {4 4 11}
were 10.3%, 8.6%, and 7.6%,
respectively. Judging from the area fractions, the main component of the texture is {4 4 11} ![]() 11 11 8
11 11 8![]() orientation (Dillamore orientation). The average area fraction for {001}
orientation (Dillamore orientation). The average area fraction for {001} ![]() 110
110
![]() orientation was 0.2% in
the range from three and nine cycles.
orientation was 0.2% in
the range from three and nine cycles.
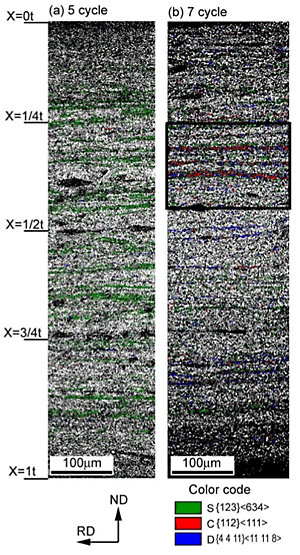
Figure 3 shows crystal orientation maps in the specimens after five and seven cycles. In the map after the five cycle (Fig. 3(a)), the banded areas with {123} ![]() 634
634![]() orientation were formed parallel to the rolling direction. These bands painted by green were obviously observed in the center layer. In this study, these areas were called "S bands". The thickness of S bands formed in the center layer ranged from 4
orientation were formed parallel to the rolling direction. These bands painted by green were obviously observed in the center layer. In this study, these areas were called "S bands". The thickness of S bands formed in the center layer ranged from 4![]() m to 15
m to 15![]() m, and the interval of the bands from 5
m, and the interval of the bands from 5![]() m to 30
m to 30![]() m. The thickness of S bands in the map after seven cycles (Fig. 3(b)) was thinner than that in the map after five cycles (Fig. 3(a)). The number of S bands also decreased with increasing the number of cycles from five to seven. It should be noted that banded areas with {112}
m. The thickness of S bands in the map after seven cycles (Fig. 3(b)) was thinner than that in the map after five cycles (Fig. 3(a)). The number of S bands also decreased with increasing the number of cycles from five to seven. It should be noted that banded areas with {112} ![]() 111
111![]() and {4 4 11}
and {4 4 11} ![]() 11 11 8
11 11 8![]() orientations adjoined those with {123}
orientations adjoined those with {123} ![]() 634
634![]() orientation.
orientation.
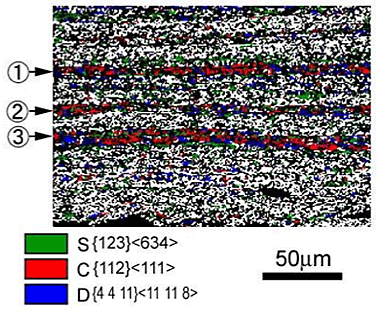
Figure 4 shows a map magnified the square area of Fig. 3(b). As indicated by arrows of ![]() ,
, ![]() and
and ![]() , it is obvious that the banded areas with {112}
, it is obvious that the banded areas with {112} ![]() 111
111![]() and {4 4 11}
and {4 4 11} ![]() 11 11 8
11 11 8![]() orientations were
formed adjoining those with {123}
orientations were
formed adjoining those with {123} ![]() 634
634![]() . Thus, based on the results of Figs. 2, 3 and 4, {123}
. Thus, based on the results of Figs. 2, 3 and 4, {123} ![]() 634
634![]() orientation rotated toward both {112}
orientation rotated toward both {112} ![]() 111
111![]() and {4 4 11}
and {4 4 11} ![]() 11 11 8
11 11 8![]() orientations during ARB process,
which became the primary and the secondary texture component after seven and nine cycles. The
deformation mechanism in the single crystal is discussed in this paper in terms
of the full-constraints and the relax-constraints models.
orientations during ARB process,
which became the primary and the secondary texture component after seven and nine cycles. The
deformation mechanism in the single crystal is discussed in this paper in terms
of the full-constraints and the relax-constraints models.