It has been reported that the mechanical properties of aluminium alloys are sometimes sensitive to the presence of micropores. For example, large variability in mechanical properties such as ductility, strength and fatigue characteristics has usually been attributed to the existence of high density micropores in cast alloys. Recently, it has been revealed that micropores are associated with ductile fracture mechanism in some wrought aluminium alloys. A detailed examination of the 4D characteristics of micropore growth is utilised to discuss the contributions of micropores to ductile fracture.
The material used was an AA2024 aluminium alloy with a high tolerance to damage, which is employed to fabricate structural members for aircraft. A high-resolution X-ray CT experiment was performed using the X-ray imaging beamline, BL20XU, of the Japanese synchrotron radiation facility, SPring-8. The in-situ loading stage allowed the specimen to be scanned under monotonic tensile loading.
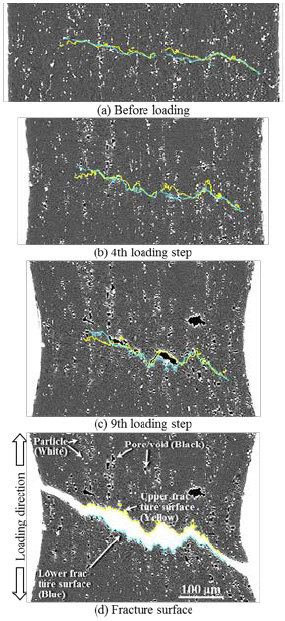
A large number of particles, which exhibit inhomogeneous distribution, are observed in the specimen. It is noteworthy that although considerable damage had accumulated just before the final fracture from a macroscopic point of view, almost no micropores and/or damage is observed in some areas. This implies that damage is inevitably associated with either particle fracture or micropore growth that is adjacent to particles. Fig. 1 (a) - (d) also shows the magnified views of the interior of the material during deformation. In general, void initiation caused by particle fracture occurs after the maximum load has been reached. Fig. 1 (b) corresponds to its vicinity. Pre-existing hydrogen micropores are highlighted in red and yellow. Of these, the yellow pores coalesce and merge into a fracture surface later. At this stage these micropores are observed together with the initiation of microvoids (highlighted in dark blue). It should be noted that the hydrogen micropores are much larger than the microvoids. There are seven yellow micropores in this field of view, and they have already coalesced with neighbouring micropores at the stage shown in Fig. 1 (b). Particle A exhibits multiple fractures owing to its size and irregular shape, leading to the formation of several relatively coarse microvoids. The microvoids subsequently coalesced, and a crack originated from the hydrogen micropores in Fig. 1 (d). Although the number of microvoids increases more with loading than the number of hydrogen micropores, we can conclude that the pre-existing hydrogen micropores dominate the fracture process from a relatively early stage.
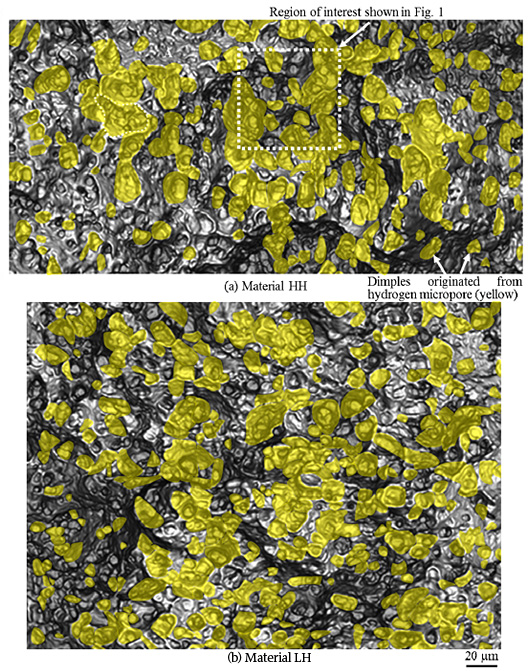
Figures 2 show the estimated fracture paths (yellow and blue lines for upper and lower fracture surfaces, respectively) in images obtained before and during loading. The fracture surfaces shown in Figs. 2 are obliquely directed, with significant surface asperity. The estimated fracture paths in the image obtained before loading are, however, relatively flat, suggesting that the significant fracture surface roughness can be attributed to complex local deformation during the fracture process. It would appear in Figs. 2 that the predicted fracture paths connect agglomerated particles. Since there is a tendency for many hydrogen micropores to form on particles in such regions, it is hard to assess the actual fracture mechanisms using these data alone. Accordingly, micropores that are located along the estimated fracture paths before loading have been identified and tracked chronologically to match them with dimple patterns on the fracture surfaces. Each dimple is a basic structural unit that corresponds to a single local fracture event. Fig. 3 shows 3D fracture surface images. The regions highlighted in yellow in Fig. 3 originated from hydrogen micropores. These regions occupy a fractional area of about 41.5 and 39.0 % of the entire fracture surfaces for materials LH and HH, respectively. The characteristic effects of the micropores in the two materials are not significantly different. It seems that the yellow regions are connected in a somewhat reticulate manner, while the fracture surface formed by particle damage fills the remaining spaces. This is consistent with the tendency toward prior micropore growth supports the view that this growth dominates the entire ductile fracture process beyond the obtained fractional area values.
We have focused on high-density micropores filled with hydrogen in the aluminium alloy. We have clarified that high-density pre-existing micropores, which were formed during the production process, exhibit premature growth and coalescence under external loading, thereby inducing ductile fracture. The process is incidentally supplemented by the well-established ductile fracture mechanism based on particle damage.