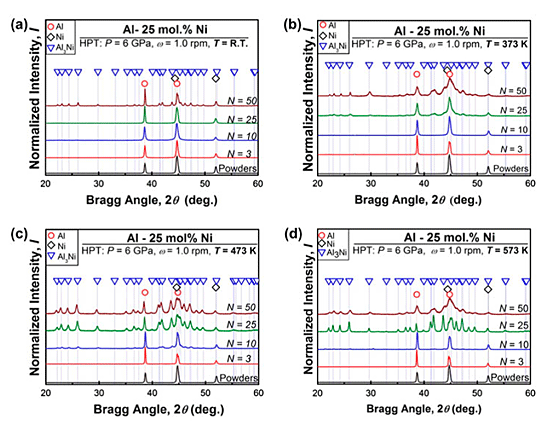
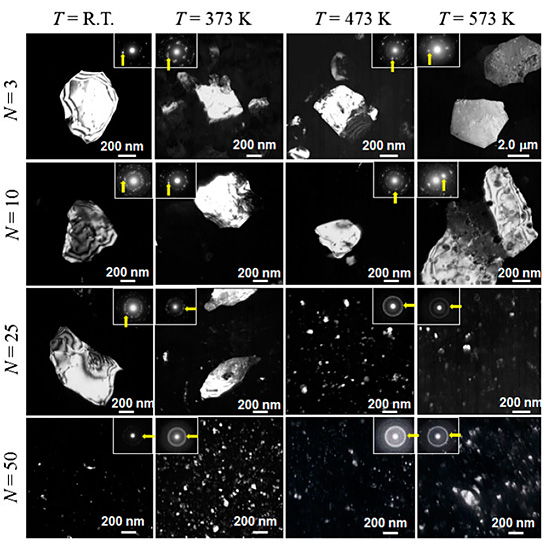
A bulk form of nanograined intermetallic Al3Ni was produced by severe plastic deformation using high-pressure torsion (HPT). Powder mixtures of 75mol% Al and 25 mol% Ni were processed by HPT at a selected temperature in the range of room temperature (RT) to 573 K under a pressure of 6 GPa. X-ray diffraction analysis revealed that the Al3Ni intermetallic formed after processing for 50 revolutions at RT but, as the processing temperature increased, less revolutions (i.e. lower imposed strain) were required for the formation of Al3Ni as shown in Fig.1. Observations by transmission electron microscopy showed that the microstructure consists of ultrafine grains having a size of 300![]() 2000 nm after 3 and 10 revolutions as in Fig.2. It was also shown from Fig.2 that once the Al3Ni formed after a higher number of revolutions, equiaxed nanograins with a size of
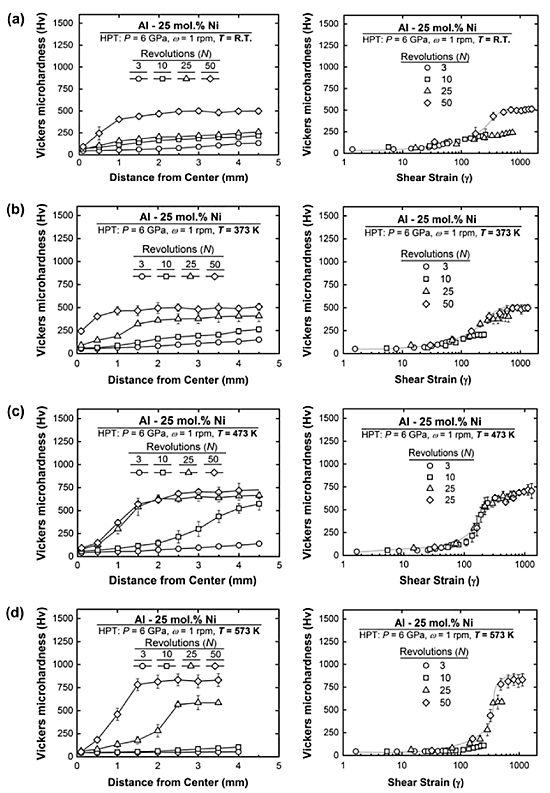
2000 nm after 3 and 10 revolutions as in Fig.2. It was also shown from Fig.2 that once the Al3Ni formed after a higher number of revolutions, equiaxed nanograins with a size of ![]() 30 nm prevailed with a significant increase in hardness. As shown in Fig.3, the increase in hardness was more significant when processed at higher temperatures because of increasing the fraction of Al3Ni. It was considered that the solid-state formation of Al3Ni occurred due to enhanced diffusion (i.e. decreased activation energy for diffusion) through the presence of high density of lattice defects.
30 nm prevailed with a significant increase in hardness. As shown in Fig.3, the increase in hardness was more significant when processed at higher temperatures because of increasing the fraction of Al3Ni. It was considered that the solid-state formation of Al3Ni occurred due to enhanced diffusion (i.e. decreased activation energy for diffusion) through the presence of high density of lattice defects.
Effect of temperature on solid-state formation of bulk nanograined
intermetallic Al3Ni during high-pressure torsion
[Published in Philosophical Magazine , 94 (2013) pp 876-887.]
 |
|
|
Fig. 1. XRD spectra of samples processed by HPT for N = 3, 10, 25 and 50 at (a) RT, (b) 373 K, (c) 473 K and (d) 573 K including as-received powder mixtures. |
 |
|
|
Fig. 2. TEM dark-field images and corresponding SAED patterns for samples processed by HPT for N = 3, 10, 25 and 50 at RT, 373, 473 and 573 K. Dark-field images were taken by diffracted beams indicated by arrows in SAED patterns. |
 |
|
|
Fig. 3. Microhardness plotted against distance from disc centre (left) and shear strain (right) for samples processed by HPT for N = 3, 10, 25 and 50 at (a) RT, (b) 373 K, (c) 473 K and (d) 573 K. |