Porous aluminum with high porosity is very lightweight and has high energy absorptivity. Plateau stress is an important mechanical property that is closely related to the energy absorptivity of porous aluminum. In this study, considering that a locally deformed layer is formed in the plateau region and the porosity greatly affects the value of the plateau stress, we attempt to estimate the plateau stress of porous aluminum.
In this study, two types of porous aluminum were used. One was porous aluminum fabricated using Al-Si-Cu aluminum alloy ADC12 (equivalent to A383.0 aluminum alloy) die castings and the other was a commercially available porous aluminum (ALPORAS). In the fabrication of ADC12 porous aluminum, two types of ADC12 plate with total amounts of contained gases of 93.7 cm3/100gAl and 195.2 cm3/100gAl were used. The foamable precursors of ADC12 was fabricated by the FSP (friction stir processing) route. The foamed samples were cut by electro-discharge machining to obtain the compression specimens with dimensions of 15 mm ![]() 15 mm
15 mm ![]() 15 mm for ADC12 plates with a gas content of 93.7 cm3/100gAl and the compression specimens with dimensions of 20 mm
15 mm for ADC12 plates with a gas content of 93.7 cm3/100gAl and the compression specimens with dimensions of 20 mm ![]() 20 mm
20 mm ![]() 20 mm for ADC12 plates with a gas content of 195.2 cm3/100gAl. The compression specimens of ALPORAS were cut from a large ALPORAS block by electro-discharge machining, and the specimens with dimensions of 25 mm
20 mm for ADC12 plates with a gas content of 195.2 cm3/100gAl. The compression specimens of ALPORAS were cut from a large ALPORAS block by electro-discharge machining, and the specimens with dimensions of 25 mm ![]() 25 mm
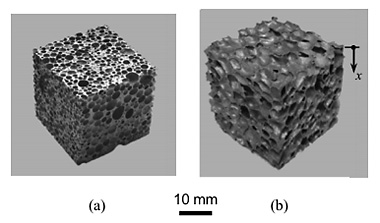
25 mm ![]() 25 mm were fabricated. Figures 1(a) and 1(b) show an ADC12 specimen with a gas content of 195.2 cm3/100gAl and an ALPORAS specimen, respectively. Each compression specimen was scanned by a microfocus X-ray CT system. The compressive test for each compression specimen was carried out at room temperature using an Instron type testing machine with a load capacity of 98 kN.
25 mm were fabricated. Figures 1(a) and 1(b) show an ADC12 specimen with a gas content of 195.2 cm3/100gAl and an ALPORAS specimen, respectively. Each compression specimen was scanned by a microfocus X-ray CT system. The compressive test for each compression specimen was carried out at room temperature using an Instron type testing machine with a load capacity of 98 kN.
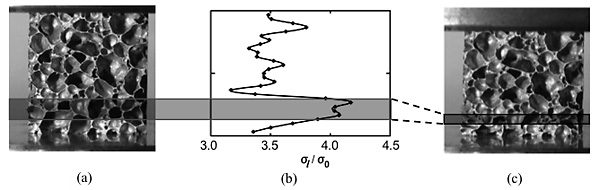
As examples of the deformation states of the compressive test specimens, Fig. 2 shows those of an ALPORAS specimen with porosity p=89.8%. Figures 2(a) and 2(c) show the initial pore structure and the deformation state at a compressive strain ![]() of 12%, respectively. Figure 2(b) shows the distribution in the height direction of the mean true compressive stress
of 12%, respectively. Figure 2(b) shows the distribution in the height direction of the mean true compressive stress ![]() l on each cross section (perpendicular to the direction of compressive loading) evaluated by the following equation:
l on each cross section (perpendicular to the direction of compressive loading) evaluated by the following equation:
| (1) |
where ![]() 0 is the nominal compressive stress applied to the specimen and pl is the porosity on each cross section perpendicular to the direction of compressive loading. From Figs. 2(a)
0 is the nominal compressive stress applied to the specimen and pl is the porosity on each cross section perpendicular to the direction of compressive loading. From Figs. 2(a)![]() 2(c), it is found that the deformation in the plateau region of porous aluminum occurs in a layer (cf. the gray shaded layer) including the maximum value
2(c), it is found that the deformation in the plateau region of porous aluminum occurs in a layer (cf. the gray shaded layer) including the maximum value ![]() lmax. From these results, using the maximum value
lmax. From these results, using the maximum value ![]() lmax of
lmax of ![]() l, we simply assume the following.
l, we simply assume the following.
(1) When the mean true compressive stress on a maximum-porosity cross section perpendicular to the direction of compressive loading ![]() lmax reaches the critical value
lmax reaches the critical value ![]() cr, a locally deformed layer and plateau stress appear.
cr, a locally deformed layer and plateau stress appear.
(2) The nominal compressive stress when local deformation occurs is equal to the plateau stress ![]() pl. From these assumptions, the plateau stress
pl. From these assumptions, the plateau stress ![]() pl can be estimated by the following equation:
pl can be estimated by the following equation:
| (2) |
where plmax is the maximum porosity on the cross section perpendicular to the direction of compressive loading. As an example of the relationship between the distance x from the top of a specimen, as shown in Fig. 1(b), normalized by the height h of the specimen, and the local porosity pl on the x-section evaluated from X-ray CT images, Fig. 3 shows the result for the ALPORAS specimen with porosity p=89.8%. From these figures, plmax can be obtained for each ADC12 and ALPORAS specimen. However, as shown in Fig. 3, the porosity evaluated using the X-ray CT images was generally lower than the porosity over the entire specimen evaluated from the density of the porous aluminum and the density of the foamable precursor before heating p (=89.8%). Thus, pl was modified by using the following equation:
 |
(3) |
where pl is the porosity over the entire specimen evaluated using the X-ray CT images. The value of (plmax) modified was evaluated from the distribution of (pl)modified. This value of (plmax)modified was used as the maximum value plmax of pl.
As the values of ![]() cr, the 0.2% proof stress
cr, the 0.2% proof stress ![]() p and flow stress
p and flow stress ![]() fl were employed. The flow stress
fl were employed. The flow stress ![]() fl is defined by the following equation:
fl is defined by the following equation:
| (4) |
where ![]() u is tensile stress. These stresses were adopted for convenience as the parameters related to plastic collapse. Figures 4(a) and 4(b) show the relationships between the results estimated by Eq. (2) (lines) and the experimental results for the plateau stresses of the ADC12 and ALPORAS specimens, respectively. In these figures, as references, the results (lines) corresponding to
u is tensile stress. These stresses were adopted for convenience as the parameters related to plastic collapse. Figures 4(a) and 4(b) show the relationships between the results estimated by Eq. (2) (lines) and the experimental results for the plateau stresses of the ADC12 and ALPORAS specimens, respectively. In these figures, as references, the results (lines) corresponding to ![]() 20% error of the estimated results for
20% error of the estimated results for ![]() p are also shown (cf. the lines for 0.8
p are also shown (cf. the lines for 0.8![]() p and 1.2
p and 1.2![]() p in Fig. 4). The variation of the experimental results was slightly large owing to the scattering of the pore structures in porous aluminum. However, it can be considered that the experimental results show a similar tendency, i.e.,
p in Fig. 4). The variation of the experimental results was slightly large owing to the scattering of the pore structures in porous aluminum. However, it can be considered that the experimental results show a similar tendency, i.e., ![]() pl decreases with increasing plmax, to the estimated results (lines) and mostly exist in the range of
pl decreases with increasing plmax, to the estimated results (lines) and mostly exist in the range of ![]() 20% of the estimated result for
20% of the estimated result for ![]() p. The estimated results for
p. The estimated results for ![]() fl closely corresponded to the maximum value in the experimental results. From these results, by simply assuming the appearance of plateau stress as mentioned above, the plateau stress
fl closely corresponded to the maximum value in the experimental results. From these results, by simply assuming the appearance of plateau stress as mentioned above, the plateau stress ![]() pl of porous aluminum can be approximately estimated from the mean true compressive stress on a maximum-porosity cross section perpendicular to the direction of compressive loading
pl of porous aluminum can be approximately estimated from the mean true compressive stress on a maximum-porosity cross section perpendicular to the direction of compressive loading ![]() lmax when
lmax when ![]() p is used as the critical value.
p is used as the critical value.