Aluminum bicrystals with {100} < 001 > / {112} < 111 > and {100} < 001 > / {123} < 634 >were deformed by plane strain compression under the same deformation conditions. The deformed bicrystals were annealed at the same annealing temperature and time. The difference in recrystallization between these bicrystals was discussed in terms of crystal orientation relationship, grain boundary mobility, and driving pressure on the boundary.
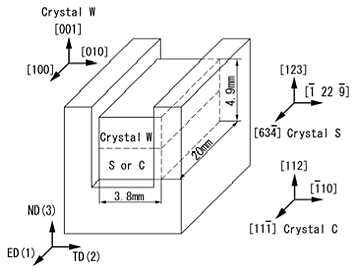
Two types of bicrystals were prepared from a 99.99% aluminum ingot. One type of bicrystal was composed of C (112) [11-1] and W (001) [100], and is called Bicrystal C/W. The crystal orientations of the other type of bicrystal was S (123) [63-4] and W (001) [100], called Bicrystal S/W. Figure 1 shows a schematic illustration of the specimen and channel die. The specimen was compressed along ND to a true strain of 0.34 at room temperature. After the specimen was electrolytically polished, the electron back-scatter diffraction (EBSD) patterns were measured in an area across the grain boundary on the TD plane.Vickers micro-hardness (load: 100 gf) was measured for Bicrystals C/W and S/W before and after deformation. The hardness of each crystal before compression was 19.8 HV in Crystal W, 20.0 HV in Crystal C, and 20.4 HV in Crystal S. The deformed Bicrystals C/W and S/W were annealed in an electric furnace maintained, and then the specimens were cooled in air. The surfaces of the TD plane of the bicrystals were etched by aqua regia. The etched patterns on the TD plane before and after annealing were compared in order to determine the occurrence of recrystallization.
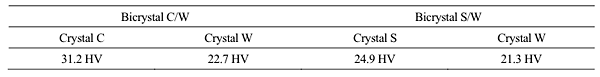
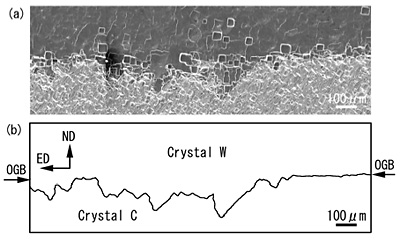
Vickers micro-hardnesses in Bicrystals C/W and S/W after deformation are listed in Table 1. In Bicrystal C/W, the hardness was 31.2 HV in Crystal C and 22.7 HV in Crystal W. In Bicrystal S/W, the hardness of Crystals S and W was 24.9 HV and 21.3 HV, respectively. The increments in hardness of Crystal C and Crystal S were greater than that of Crystal W. In addition, Crystal C had a comparatively greater increment than Crystal S. Two types of bicrystals were annealed at 400![]() for 180 s. Figure 2 shows the etched pattern and a schematic diagram depicting the grain boundary of Bicrystal C/W. SIBM occurred along the original grain boundary. The recrystallized area that bears the same etched pattern (i.e., the same crystal orientation) as Crystal W appeared to expand toward Crystal C. This suggests that the W-oriented area formed by SIBM invades Crystal C. The maximum migration distance of the SIBM boundary from its original position was 193.9
for 180 s. Figure 2 shows the etched pattern and a schematic diagram depicting the grain boundary of Bicrystal C/W. SIBM occurred along the original grain boundary. The recrystallized area that bears the same etched pattern (i.e., the same crystal orientation) as Crystal W appeared to expand toward Crystal C. This suggests that the W-oriented area formed by SIBM invades Crystal C. The maximum migration distance of the SIBM boundary from its original position was 193.9 ![]() m. The average migration distance of the SIBM boundary in the observation area was 53.9
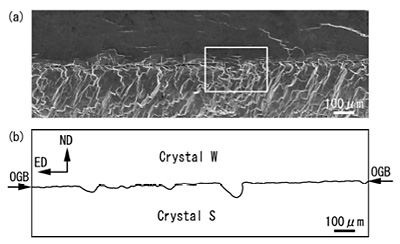
m. The average migration distance of the SIBM boundary in the observation area was 53.9 ![]() m. The etched pattern and a schematic diagram depicting the grain boundary of Bicrystal S/W are shown in Fig.3. The maximum migration distance of the SIBM boundary in the observation area was 67.9
m. The etched pattern and a schematic diagram depicting the grain boundary of Bicrystal S/W are shown in Fig.3. The maximum migration distance of the SIBM boundary in the observation area was 67.9 ![]() m. The average migration distance was 5.0
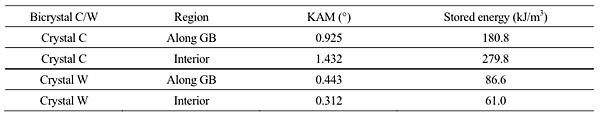
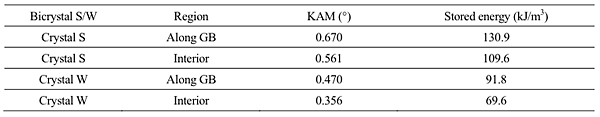
m. The average migration distance was 5.0 ![]() m. Tables 2 and 3 list the stored energies in the vicinity of the GB and those in the interiors of the component crystals. Bicrystal C/W indicates that the stored energy of Crystal C was larger than that of Crystal W. In Bicrystal S/W, the stored energy of Crystal S was larger than that of Crystal W. Comparing the stored energy of Crystal C with that of Crystal S, the former had a higher stored energy than the latter. This result corresponds with that of the Vickers micro-hardness listed in Table 1.
m. Tables 2 and 3 list the stored energies in the vicinity of the GB and those in the interiors of the component crystals. Bicrystal C/W indicates that the stored energy of Crystal C was larger than that of Crystal W. In Bicrystal S/W, the stored energy of Crystal S was larger than that of Crystal W. Comparing the stored energy of Crystal C with that of Crystal S, the former had a higher stored energy than the latter. This result corresponds with that of the Vickers micro-hardness listed in Table 1.
The difference in stored energy was ![]() E(C/W) = 94.2 kJ/m3 in Bicrystal C/W and
E(C/W) = 94.2 kJ/m3 in Bicrystal C/W and ![]() E(C/W)= 39.1 kJ/m3 in Bicrystal S/W (Tables 2 and 3). In general, a critical radius (r) for bulging of a grain boundary in SIBM is given by r=2
E(C/W)= 39.1 kJ/m3 in Bicrystal S/W (Tables 2 and 3). In general, a critical radius (r) for bulging of a grain boundary in SIBM is given by r=2![]() /
/![]() E, where
E, where ![]() and
and ![]() E are the grain boundary energy and the difference in stored energy between two adjacent crystals, respectively. With smaller critical radius, the possibility that there will be bulging of a grain boundary becomes greater. Assuming that the high-angle boundary energy is 0.324 kJ/m3, the critical radius is estimated as r(C/W) = 6.9
E are the grain boundary energy and the difference in stored energy between two adjacent crystals, respectively. With smaller critical radius, the possibility that there will be bulging of a grain boundary becomes greater. Assuming that the high-angle boundary energy is 0.324 kJ/m3, the critical radius is estimated as r(C/W) = 6.9 ![]() m in Bicrystal C/W and r(S/W) = 16.6
m in Bicrystal C/W and r(S/W) = 16.6 ![]() m in Bicrystal S/W. In terms of nucleation by bulging of grain boundary, Bicrystal C/W has an advantage over Bicrystal S/W. At the growth stage the driving pressure on the grain boundary can be expressed as the stored energy of Crystal C and Crystal S. The stored energies in the interiors of Crystals C and S were 279.8 kJ/m3 and 109.6 kJ/m3, respectively. Crystal C had higher stored energy than Crystal S. This corresponds with the result that SIBM occurred more rapidly in Bicrystal C/W than in Bicrystal S/W. The driving pressure, namely the stored energy, strongly influences SIBM. Based on the result of the orientation relationship between the component crystals after compression, the effect of grain boundary mobility on SIBM was small.
m in Bicrystal S/W. In terms of nucleation by bulging of grain boundary, Bicrystal C/W has an advantage over Bicrystal S/W. At the growth stage the driving pressure on the grain boundary can be expressed as the stored energy of Crystal C and Crystal S. The stored energies in the interiors of Crystals C and S were 279.8 kJ/m3 and 109.6 kJ/m3, respectively. Crystal C had higher stored energy than Crystal S. This corresponds with the result that SIBM occurred more rapidly in Bicrystal C/W than in Bicrystal S/W. The driving pressure, namely the stored energy, strongly influences SIBM. Based on the result of the orientation relationship between the component crystals after compression, the effect of grain boundary mobility on SIBM was small.